By Gary Schnitkey and Jim Baltz et.al
Department of Agricultural and Consumer Economics
University of Illinois
Carl Zulauf
Department of Agricultural, Environmental and Development Economics
Ohio State University
The Trend-Adjusted Yield Endorsement has been available to Illinois farmers since 2012, making 2022 the eleventh year of its availability. Use of the Trend-Adjusted Yield Endorsement increases the yields used in setting guarantees, thereby increasing protection offered by crop insurance products. The Trend-Adjusted concept was accepted by the Risk Management Agency (RMA) through a submission process for introducing new endorsements to crop insurance products. The Endorsement proposal was sponsored by the Illinois Corn Marketing Board and developed in conjunction with faculty from the University of Illinois.
Concept of the Endorsement
The Trend-Adjusted Yield Endorsement adjusts the yield used in calculating insurance guarantees. Without the Trend Endorsement, an Actual Production History (APH) yield is used to set guarantees, with the APH yield being based on an actual history of yields from the insured unit. To be based totally on historical yields, at least four years of yields must be provided. Up to ten years of yields are used in the APH yield. When more than ten yields exist from a farm, the most recent ten calculate the APH yield.
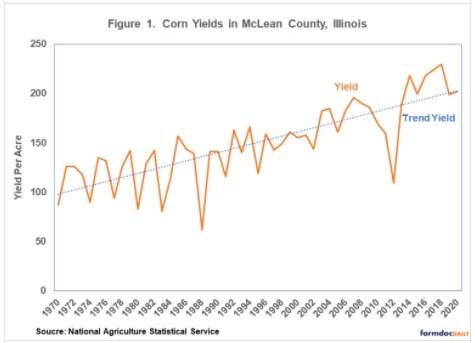
In crops with increasing yields over time, the APH yield lags the true “expected,” or most likely yield, for the coming insurance year. Figure 1 illustrates this for corn yields in McLean County. Actual yields for McLean County are shown in Figure 1, along with a trend line. The trend-line is the best statistical fit through the yearly yields. The trend-line is sloping up over time, with an average annual increase of 2.14 bushels per acre. Data in Figure 1 goes through 2020, and a very good estimate of the 2021 yield is to extend the trend line for one year. The resulting projection will almost always be higher than the average of the last ten years.
County trend factors exist for each county for which Trend-Adjustment Yield Endorsement is available. Figure 2 shows the 2022 trend factors for non-irrigated corn in Illinois. In concept, these trend factors represent the average increase in yields over time. As can be seen, trend factors vary across the state, with higher trend factors typically located in northwestern counties and the lowest factors being in southern Illinois. For corn, trend factors range from a high of 2.53 bushels per year for Carroll County to a low of 1.42 bushels per acre for Perry County. The trend factor for McLean County is 2.14 bushels per acre. The trend factors are used at the farm level to calculate a Trend Adjusted-Average Production History (TA-APH) expected yield for crop insurance policies.
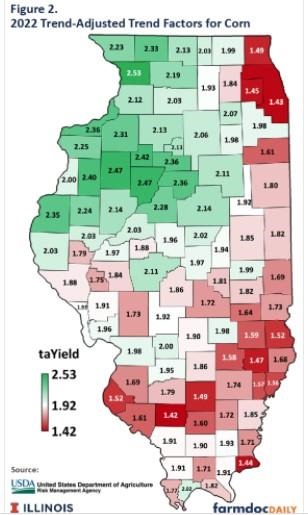
Table 1 shows an example of the 2012 TA-APH yield calculation for a McLean County farm having ten consecutive yields from 2012 through 2021. The 2012 yield is 110 bushels per acre; the 2013 yield is 189 bushels; the 2014 yield is 218 bushels per acre; and so on. This APH yield for this yield history is 199.3 bushels per acre.
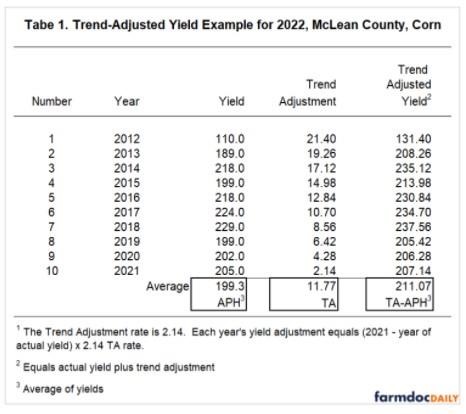
Corn in McLean County has a yield trend of 2.14 bushels/year. Under the TA-APH, each yield will be adjusted by 2.14-bushel times the number of years from the current insurance year. The further the year is from the 2022 current year, the higher is the trend adjustment. For the 2021 yield, the trend adjustment is 2.14. In 2021, the actual yield was 205 bushels per acre, and the TA-APH yield was 207.14 bushels per acre (207.14 = 205 bushels plus 2.14 trend adjustment). The trend adjustment for the 2020 yield is 4.28 bushel, or the 2.14 trend times two years from 2021. The actual yield in 2020 was 202.0 bushels, and the TA-APH yield was 206.28 bushels (202 bushels plus 4.28 trend adjustment). The above process is continued for each year in the past, and then the adjusted yields are averaged to arrive at the TA-APH.
In the example shown in Table 1, the TA-APH yield is 211.07 bushels, 11.77 bushels above the 199.3 APH yield.
Value of Trend-Adjusted Yield Endorsement
Coverage levels did not increase as a result of the trend adjustment. On average, farmers maintained the coverage level and increased the guarantee level on the crop insurance policy. Overall, this process increased the payments from the insurance products and increased the premium. An estimate of the net value to the farmer has been about $12.70 per acre.
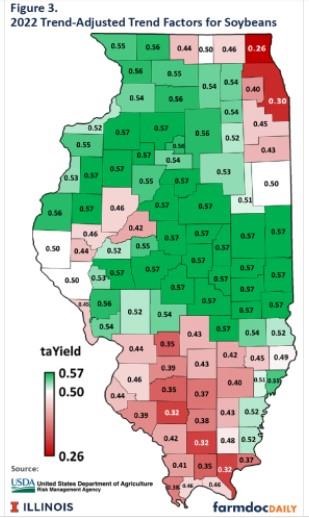
Trend adjustment also is available for soybeans, with 2022 trend factors for soybeans shown in Figure 3. Overall, the trend factors for soybeans average about .5 across Illinois, providing a value of $2.30 per acre in any given year.
Expansion of the Trend Adjustment Concept
The Trend Endorsement has expanded from its original pilot area of 12 states and two crops. Now, the Trend Endorsement is used in 41 states on 14 crops.
In addition, the trend adjustment process is now used in the commodity title program. Yields for the Agricultural Risk Coverage at the county level are trend adjusted.
Summary
Use of the Trend-Adjusted Yield Endorsement is widespread, with most farmers in Illinois making use of the endorsement. Improvements in insurance coverage have resulted from the trend endorsement.
Source : illinois.edu