By Scott Irwin
Department of Agricultural and Consumer Economics
A series of farmdoc daily articles (
September 13, 2018;
December 13, 2018;
January 16, 2019;
January 24, 2019) have examined ethanol use in light small refinery exemptions (SREs) granted under the RFS. The SREs are the main reason that D6 ethanol RINs prices crashed in the last year. Since RINs were designed to incentivize the consumption of higher ethanol blends, it is natural to think this would lead to a decline in the consumption of higher ethanol blends, such as E85. Surprisingly, the data show that E85 use in the U.S. increased sharply in the last year. This means that other factors must have been at work to offset the disincentive provided by declining D6 RIN prices. One factor is increased access to E85 pumps associated with the USDA’s
Blender Infrastructure Program. Another factor is the discount on E85 relative to E10, which widened markedly for the 10-month period between August 2017 and May 2018. We know that the discount is driven by three variables—the price of gasoline, the price of ethanol, and D6 RIN prices. What is not understood very well is exactly how these three factors interact in the pricing of E85 and E10, and consequently, how the price discount between E85 and E10 is determined. The purpose of this article is to disentangle how gasoline, ethanol, and RIN prices drive the discount of E85 relative to E10 at the pump.
Analysis
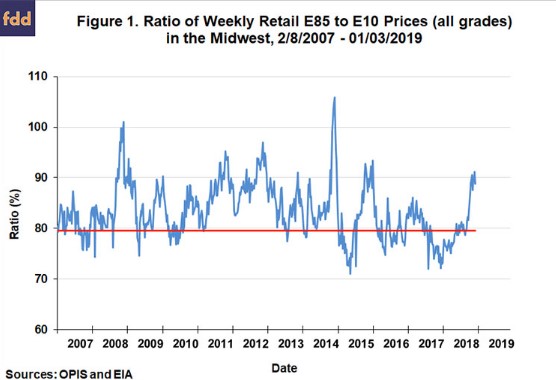
We begin by reviewing the history of E85 prices relative to E10 prices. There has been considerable research in the agricultural economics literature on the discount that drivers in the U.S. require in order to switch to E85 from E10 (e.g., Pouliot, Liao, and Babcock, 2018). At a minimum, it is sensible to think that drivers will demand a price discount large enough to offset the energy loss associated with E85. From a pure chemical standpoint, a gallon of ethanol has approximately two-thirds of the energy value of petroleum gasoline. Assuming E85 consists of an average of 74 percent ethanol, the price discount on E85 relative to E10 needs to be 20.5 percent to compensate for the lower miles per gallon (energy value) of E85.
Figure 1 plots the retail price of E85 in the Midwest as a percentage of the retail E10 price over February 8, 2007 through January 3, 2019. The red line is the breakeven E85 price as a percentage of the E10 price (79.5 percent) that equates the energy value of the two fuels. The figure shows that for most of the time since 2007 the relative price of E85 exceeded the breakeven energy level, and for long stretches of time by a considerable amount. There are two notable exceptions, the first is a 6-month period in 2015 and the second is a 10-month period from August 2017 through May 2018. The latter period is of most interest for the present analysis. About half of the August 2017-May 2018 period overlaps with the surge in E85 use from December 2017-October 2018. This suggests that E85 pricing played a role in stimulating the increase in E85 use that occurred in the last year (farmdoc daily,
January 24, 2019).
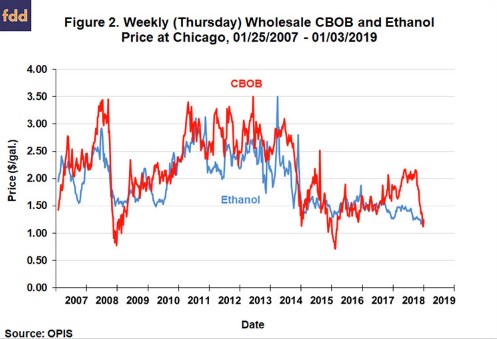
Figures 2 and 3 present the three factors that should drive the price discount of E85 relative to E10—the price of gasoline (CBOB), the price of ethanol, and D6 RIN prices. It is clear from Figure 2 that ethanol was very cheap relative to CBOB for nearly all of 2018. The steep drop in CBOB prices late in 2018 brought gasoline and ethanol prices back to parity. Figure 3 shows the crash in D6 ethanol RINs that started in December 2017. The RIN price dropped from about $0.90 per gallon to under $0.10 before recovering back to about $0.20. Therefore, we know that ethanol has been cheap relative to gasoline for most of the last year and that RIN prices have dropped precipitously. We also know that E85 contains more ethanol (74 percent on average) than E10, so the price of E85 should benefit more from relatively low ethanol prices than the price of E10. But it is also true that the price of E85 should be more sensitive to the price of D6 RINs, which could offset the benefit from relatively cheap ethanol prices. A model is needed to sort out the differential impacts of gasoline, ethanol, and D6 RIN prices on E85 and E10 prices at the pump, and that is what we turn to below.

A simple linear (additive) model of E85 and E10 prices should be sufficient for present purposes. Table 1 presents expected coefficients for linear models of retail E85 and E10 prices. The intercept in both models is 0.75 to reflect the average markup between wholesale and retail prices and gasoline taxes. The coefficients on ethanol and CBOB prices simply reflect the proportions of ethanol and CBOB assumed to be in E85 and E10 blends. Without consideration of RIN price impacts, the retail price of E85 and E10, respectively, would be predicted as follows:
E85 price = 0.75 + 0.74 X Ethanol price + 0.26 X CBOB price,
E10 price = 0.75 + 0.10 X Ethanol price + 0.90 X CBOB price.
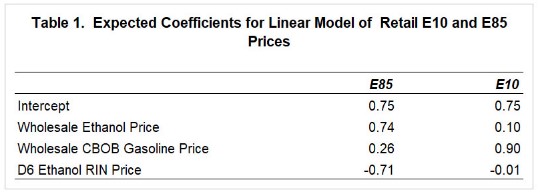
The only complicated part of the model is the expected impact of D6 RIN prices at the pump. Much ink has been spilled on this particular issue. “Full pass-through” of RIN prices to the retail pump level of the fuel supply chain are assumed in Table 1. This does not mean that pump prices change one-for-one with D6 prices. The RFS was designed to incentivize fuel blends with higher biofuels content relative to lower biofuels content through the RIN mechanism. The higher the biofuels content the more impact that RIN prices should have on pump prices. This is readily seen in Table 1 where the coefficient on D6 RIN prices is expected to be -0.71 for E85 and only -0.01 for E10. Note that the coefficient on E85 will vary with the assumed ethanol content of E85. In numerical terms, the coefficients imply that a $1 increase in RIN prices is expected to drop the price of E85 by $0.71 but the drop in the price of E10 is only $0.01. For those interested in further details, excellent discussions of the theory of RIN price pass-through in competitive fuel markets can be found in Burkholder (2014) and Stock (2015).
With this background, we can now state the full expected linear models of the retail prices of E85 and E10, respectively, as follows:
E85 price = 0.75 + 0.74 X Ethanol price + 0.26 X CBOB price -0.71 X D6 price,
E10 price = 0.75 + 0.10 X Ethanol price + 0.90 X CBOB price – 0.01 X D6 price.
The next step is to take the models to the data and see how closely reality lines up with the predicted coefficients. Table 2 presents regression estimates of the E85 model based on weekly data for the Midwest from January 5, 2012 through January 3, 2019. The sample starts in 2012 in order to avoid complications introduced by the blenders tax credit (VEETC) for ethanol that was in place before 2012. It should also be noted that results may differ for other regions of the U.S. The overall explanatory power of the weekly E85 model is quite high, with an R-square of 0.95, which implies that the variation in the three independent variables jointly explain 95 percent of the variation in E85 prices during the sample period. The standard error indicates that about 2/3 of the time the prediction error of the model, without regard to sign, is $0.13 per gallon.
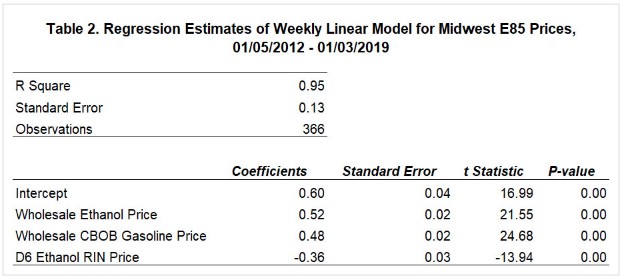
The estimated coefficients for the E85 model in Table 2 all have the expected signs and are statistically significant, but the magnitudes differ in meaningful ways from theoretical expectations. First, the intercept of 0.60 is less than the assumed wholesale-retail spread of 0.75. Second, the coefficient on the ethanol price is much smaller than expected and the coefficient on CBOB prices is much higher. This indicates that E85 prices are about equally sensitive to wholesale ethanol and CBOB gasoline prices. Third, the coefficient on D6 RIN prices is about half the magnitude as expected, which implies that E85 pricing at the retail level does not benefit as much from RIN price incentives as it should. This result has been previously reported in the literature on RIN price pass-through (Knittel, Meiselman, and Stock, 2017). One possible explanation is that RIN prices are passed through to the retail level with a time lag. Another is that blenders have market power in the fuel supply chain and profit by capturing some of the RIN price benefits.
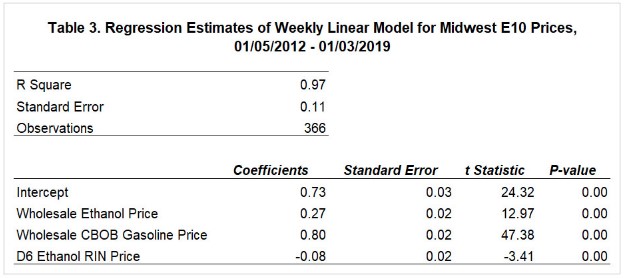
Table 3 reports the corresponding regression estimates for the E10 pricing model. Once again, the overall explanatory power of the model is quite high, with an R-square of 0.97, which implies that the variation in the three independent variables jointly explain 97 percent of the variation in weekly E10 prices during the sample period. The standard error indicates that about 2/3 of the time he prediction error of the model, without regard to sign, is $0.13 per gallon. The estimated coefficients for the E10 model in Table 3 all have the expected signs and are statistically significant. The magnitudes of the coefficient estimates are closer to theoretical expectations than with the E85 model, with the exception of the RIN price coefficient. Retail E10 prices are more sensitive to ethanol and less sensitive to CBOB prices than expected, but the differences are not large. The coefficient on D6 prices of -0.08 is substantially higher in absolute terms than expected. This indicates that E10 prices have benefited more from higher RIN prices than theory predicts. It should be noted that the coefficient on D6 RIN prices is estimated much less precisely than the other coefficients.
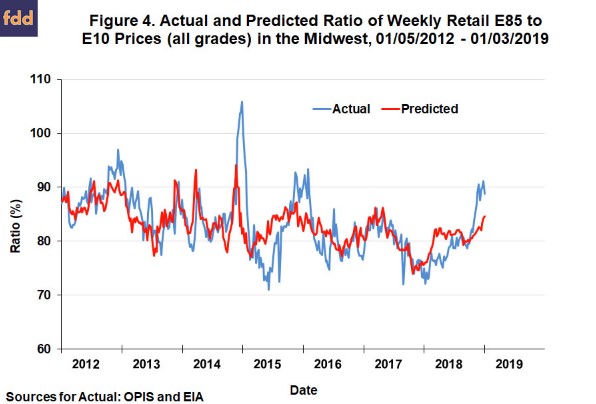
The final step of the analysis is to use the estimated regression models of E85 and E10 prices to explain what drove the increase in the E85 discount relative to E10 between August 2017 and May 2018 (Figure 1). We use the regression model predictions of E85 and E10 prices to compute a predicted ratio of retail E85 and E10 prices in the Midwest over January 5, 2012 through January 3, 2019. This predicted ratio is plotted in Figure 4 along with the actual ratio of retail E85 and E10 prices. The predicted ratio generally tracks the actual ratio reasonably well, which is not surprising given that the underlying regression models of E85 and E10 prices have such high explanatory power. In particular, the predicted ratio shows a dip during August 2017 through most of the May 2018 period.
Since the pricing models mirrored the widening of the E85 discount during the period in question, we can use the models to dig deeper into what happened. Essentially, three things happened: i) the post-December 2017 drop in D6 RIN prices did not increase E85 prices as much as expected because the pass-through of D6 RIN prices to retail E85 prices is about half of what theory predicts; ii) the post-December 2017 drop in D6 RIN prices increased E10 prices more than expected because the pass through of D6 RIN prices to retail E10 prices is about eight times what theory predicts; and iii) the sharp rise in CBOB gasoline prices increased E85 prices less than E10 prices because E10 prices are much more sensitive to gasoline prices.
Implications
In order to understand the changing price discount at the pump of E85 relative to E10 it is necessary to disentangle the influence of gasoline, ethanol, and RIN prices on the price of the two blends. Regression models of retail E85 and E10 prices were estimated using weekly data for the Midwest. These models have high explanatory power (95 percent or more), but the coefficients on gasoline, ethanol, and D6 RIN prices generally differ from the predictions of theory. Most notably, retail E85 prices are about half as sensitive to D6 RIN prices as expected and retail E10 prices are about eight times more sensitive than expected. Having said that, it is important to emphasize that E85 prices are still much more sensitive to RIN prices than E10 prices. The predicted price discount on E85 relative to E10 based on the regression model tracks the actual price discount reasonably well. This lets us determine what was driving the substantial widening in the E85 price discount over August 2017 through May 2018. Essentially, E85 prices increased less and E10 prices increased more than expected as a result of the crash in D6 RIN prices, and the sharp rise in CBOB gasoline prices increased E85 prices less than E10 prices because E10 prices are much more sensitive to gasoline prices. The models developed in the article should be useful in the future as questions arise about the pricing of E85 relative to E10.