By Carl Zulauf
Department of Agricultural, Environmental and Development Economics
Ohio State University
Gary Schnitkey and Nick Paulson et.al
Department of Agricultural and Consumer Economics
University of Illinois
It is not uncommon to read or hear the concern that the US is a residual supplier of corn, soybeans, and wheat to the world. In other words, the US becomes a source only if other sources are unavailable. An implication of the US being a residual supplier is that its exports of corn, soybean, and wheat should vary more than other large exporters. This implication is examined for 13 country-crop combinations. Variability of US corn, soybean, and wheat exports is generally found not to be high when compared with other large exporters of these crops. Such a finding is not consistent with the US being a residual supplier of corn, soybeans, and wheat to the world. This finding should make US agriculture more comfortable that export-led demand growth is a viable and sustainable strategy.
Analysis
The 2011-2020 crop years are examined. The initial year reflects the emergency of Kazakhstan, Russia, and Ukraine as large wheat and corn exporters following the higher prices that began in 2007. A large exporter is defined as a country whose exports of a crop exceeded 100 million bushels each year from 2011 through 2020. Thirteen country-crop combinations met this definition. Exports for a year are compared to average exports for the 3 prior years. For example, US exports of corn for 2020 are compared to average US corn exports for 2017-2019. Variability is measured as the standard deviation of the percent deviation of a year’s export from average exports for the 3 prior years. The data used in this analysis come from the US Department of Agriculture’s Production, Supply, and Distribution data set. Trends in country export shares for these 3 crops were examined in the farmdoc daily article of February 1, 2021.
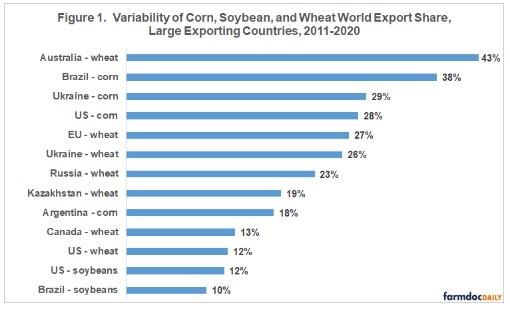
Variability of Exports
Export variability ranged from 9% for Brazilian soybeans to 47% for Australian wheat (see Figure 1). Average variability of corn, soybean, and wheat exports is 28%, 20%, and 29%, respectively. Variability of US wheat, soybean, and corn exports ranked respectively 2nd, 4th, and 9th lowest among the 13 country-crop combinations.
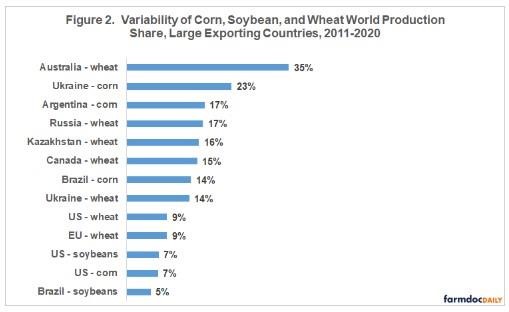
Variability of Production
Figure 1 does not consider factors that may impact export variability. One factor is likely to be production variability. The more production varies the more exports are likely to vary due to variation in price and exportable supplies. Using the same formula to calculate variability, production variability ranged from 7% for Brazilian soybeans to 37% for Australian wheat (see Figure 2). Variability of US corn, soybean, and wheat production ranked among the 5 lowest. Across the 13 country-crop combinations, production variability averaged 17% vs. 26% for export variability and explained 40% of export variability. Forty percent is usually considered a high degree of explanation for a single variable.
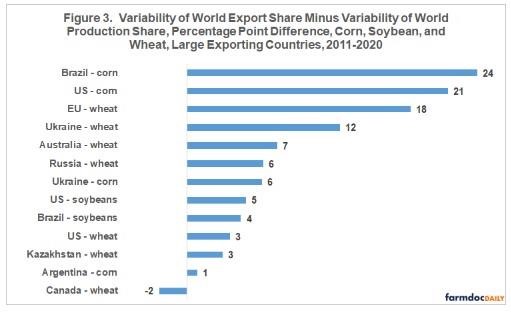
Adjusted Export Variability
It is not clear how best to adjust export variability for production variability. A simple adjustment is to subtract production variability from export variability. Export variability minus production variability for US corn, soybeans, and wheat is 23 percentage points (pp) (33% – 10%), 5 pp (18% – 13%) and 4 pp (12% – 8%), respectively (see Figures 1-3). Export minus production variability was highest for US and Brazilian corn at 23 pp. US wheat and soybean export variability ranked 5th and 6th lowest after removing production variability. Production varied more than exports only for Canadian wheat, resulting in a negative difference. Average export minus production variability was nearly identical for the 3 crops: 8 pp for soybeans and 10 pp for corn and wheat. See Data Note.
Assessment
Compared with other large exporters, variability of US corn, soybean, and wheat exports is high only for US corn exports and only after adjusting for the variability of production, which is low for the US. This finding is not consistent with the idea that the US is a residual supplier of corn, soybeans, and wheat to the world, which in turn should make US agriculture feel more comfortable with the viability and sustainably of export-led demand growth.
Data Note
To cross check this analysis, variability of the share of world exports and production for the 13 country-crop combinations was examined. While some differences were found, they were minimal and did not alter the findings and conclusions of this analysis.
Source : illinois.edu