By Joe Janzen
Department of Agricultural and Consumer Economics
University of Illinois
The US Department of Agriculture released its latest World Agricultural Supply and Demand Estimates, or WASDE on Wednesday, February 8. The WASDE report contained limited changes to US and world corn and soybean balance sheets. Corn and soybeans remain scarce and markets have maintained price levels well above long-run levels. Historically, elevated price levels like those seen since late-2020 have been resolved by higher than expected production either in the United States or elsewhere. This article considers possible triggers for a return to long-run price levels and the likely timing of such a price decline were it to occur in the coming calendar year.
US Corn and Soybean Balance Sheet
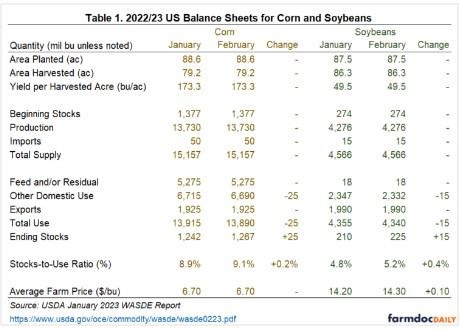
As most analysts expected, the USDA made only minor changes to its US corn and soybean balance sheets in the February WASDE report. The supply side was unchanged, following the release of National Agricultural Statistics Service Annual Summary estimates of acreage and yield estimates in the January report. Both corn and soybeans saw slight reductions in projected domestic use. For corn, ethanol use was dropped by 25 million bushels as implied ethanol use continues to come in slightly below expectations. Similarly, domestic soybean crush use was dropped by 15 million bushels. Forecasted exports for both crops remained unchanged.
The relatively small changes in projected domestic use increased ending stocks slightly for both corn and soybeans. The stocks-to-use ratio increased 0.2 percentage points to 9.1% for corn. Soybean ending stocks-to-use rose 0.4 percentage points to 5.2%. It is now apparent that the US will finish the 2022/23 marketing year with tight supply and demand conditions. This is the third consecutive marketing year in row where US stocks-to-use will be below long run levels.
The proximate cause of tightness in US corn and soybean balance sheets is subpar yield, particularly in the western corn belt. The difference between realized national average corn yield for 2022/23 and USDA’s trend-based initial yield projection of 181 bushels per acre for corn and 51.5 bushels per acre for soybeans implies a roughly 600 million bushel production shortfall for corn. This amount excludes lost production due to abandoned or unplanted acres that were otherwise intended to be harvested for grain production. Lower than expected national soybean yield resulted in almost 170 million bushels in lost production. Obviously, adding these amounts to 2022/23 supply would significantly loosen constraints on availability.
World Supply and Demand Changes
With only minor changes in the US supply and demand balance, the market also closely monitored international supply and demand conditions. USDA made a few significant changes to its world corn and soybean balance sheets for 2022/23. Estimated production for Argentina declined by 5 million metric tons (approximately 200 million bushels) to 47 million metric tons based on ongoing drought in the cone of South America. Argentina’s exports were also lowered by 3 million metric tons, although these declines were more than offset by increases in projected exports from Brazil and Ukraine. Overall, global stocks tightened slightly.
For soybeans, Argentina production similarly contained the biggest change in the global balance sheet. Argentina production was estimated lower by 4.5 million metric tons to 41 million metric tons. Part of a concurrent decline in projected Argentine exports was offset by increases in exports from Brazil. Global stocks for the 2022/23 marketing year were lowered by 1.5 million metric tons, similar but proportionally larger as a share of use than the decline in global corn ending stocks.
Possible Timing for a Return to Lower Prices
Corn and soybean markets have maintained elevated price levels since late 2020 when strong export demand, particularly for corn from China, combined with smaller than anticipated US crops to limit crop availability. Figure 1 shows the history of pre-planting (i.e. February) and harvest time prices for the new-crop December corn futures contract. The figure shows that high and rising prices between planting and harvest as observed recently are relatively anomalous, though a similar sequence of prices did occur in 2010-2012.
Figure 1 also suggests that high prices rarely stay above long-run average levels for long (See: farmdoc daily April 22, 2016; May 31, 2022). Since 2006, the average price of the December corn futures contract at harvest has been $4.51 per bushel. Pre-planting futures prices have been above this level in just six years since 2006. Four of these were part of the price spikes seen in 2011 and 2012 and 2021 and 2022. In the other two cases in 2008 and 2013, prices crashed from planting to harvest.
Current new-crop December 2023 corn futures have traded at around $5.95 per bushel since the start of February. If high prices tend not to persist, what event might cause corn markets to break its current high-price fever? The current US supply and demand situation shown in table 1 suggests US market conditions will remain tight through the remainder of this marketing year. Thus, the most likely events to boost global corn availability are weather-related production shocks that ease the need for carryover stocks from the 2022/23 marketing year. Importantly, these shocks must not already be factored into current prices.
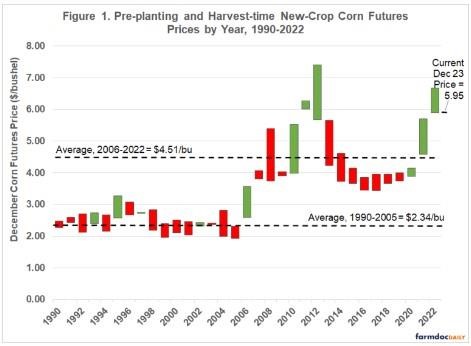
Note: The top and bottom of each bar indicate price levels. Red bars indicate years where harvest prices were below pre-planting prices, green where harvest prices were above pre-planting prices. Pre-planting price is the average price of December corn futures in the month of February. Harvest price is the average price of December corn futures in the month of November.
Source: Bloomberg
The probable triggering event for lower corn prices is a larger than expected harvest in either Brazil or the US in calendar year 2023. While a large anticipated Brazilian corn crop is already part of the market’s expectations for available supply in 2023, the size of the South American crop is anything but set in stone. Brazil’s second or safrinha corn crop makes up the bulk of its production (See: farmdoc daily, April 12, 2021; January 12, 2022).The safrinha corn crop will only be harvested between May and August so much weather and production news remains to come. At the same time, US production-related shocks are possible from the time planted acreage estimates for US corn and soybeans begin arriving in March to the conclusion of the production season this coming fall.
Nothing now known precludes the possibility of poor weather and smaller than expected harvests in 2023. If that happens, high prices would be in the offing for a third consecutive year. However, farmers around the world have every incentive with current high prices to increase production. When this production response is realized, prices will fall. Note this does not mean lower prices are unlikely until the fall of 2023 when the US harvests corn and soybeans. Production news at any time during the crop cycle may precipitate lower prices. Past prices highlight the presence of downside risk in the current market environment.
Source : illinois.edu