Overview
Wheat was up; soybeans and cotton were down; and corn was mixed for the week.
The USDA released details on the Coronavirus Food Assistance Program (CFAP) direct payments to producers this week. Direct payments will be made to producers for corn, upland cotton, and soybeans, in addition to other non-specialty crops, specialty crops, livestock, and dairy (a full list of commodities is available at https://www.farmers.gov/cfap). Of note to Tennessee crop producers, winter wheat was not assigned a payment.
The payment rate for non-specialty crops was made up of two components: 1) a CARES Act payment rate; and 2) a CCC payment rate. The CARES Act payment rates are: $0.32/bu, $0.45/bu, and $0.09/lb for corn, soybeans, and upland cotton. The CCC payment rates for corn, soybeans, and upland cotton are: $0.35/bu, $0.50/bu, and $0.10/lb. Both payments are made on 50% of eligible inventory. So actual payments received by the producer will be $0.335/bu, $0.475/bu, and $0.095/lb for eligible inventory of corn, soybeans, and cotton. Payment eligible inventory is the lesser of 50% of 2019 production or inventory held unpriced as of January 15, 2020.
So for example, if a producer’s 2019 corn production was 200,000 bushels and as of January 15, 2020 he had 150,000 bushels remaining unpriced in storage, he would receive payment on only 100,000 bushels, equal to $33,500 (100,000 bu x $0.335/bu). However, if instead of 150,000 bushels held unpriced, the producer only had 25,000 bushels on January 15, 2020 he would receive $8,375 (25,000 bu x $0.335).
A $250,000 payment limit applies per legal entity for all eligible commodities. An exception to the payment limit is provided to corporate entities that have more than one shareholder. For applicable corporate entities payment limits can expand to $500,000 (two shareholders) or $750,000 (three shareholders).
Program sign up will commence May 26 and end August 28, 2020 with USDA- Farm Service Agency. Producers should call local offices or work on line to complete the CFAP application and any other required USDA paper work. Additional clarification on eligible commodities and payments will be provided by USDA in the next few days.
Corn
Ethanol production for the week ending May 15 was 0.663 million barrels per day, up 46,000 barrels from the previous week. Ethanol stocks were 23.626 million barrels, down 0.564 million barrels compare to last week. Corn net sales reported by exporters for May 8-14 were down compared to last week with net sales of 34.9 million bushels for the 2019/20 marketing year and net sales cancellations of 1.2 million bushels for the 2020/21 marketing year. Exports for the same time period were down 4% from last week at 49.7 million bushels. Corn export sales and commitments were 72% of the USDA estimated total exports for the 2019/20 marketing year (September 1 to August 31) compared to the previous 5-year average of 93%. Across Tennessee, average corn basis (cash price-nearby futures price) strengthened or remained unchanged at Memphis, Northwest Barge Points, Northwest, and Upper-middle Tennessee. Overall, basis for the week ranged from 11 under to 25 over, with an average of 8 over the July futures at elevators and barge points. July 2020 corn futures closed at $3.18, down 1 cent since last Friday. For the week, July 2020 corn futures traded between $3.16 and $3.25. Jul/Sep and Jul/Dec future spreads were 4 and 14 cents.
Corn | Jul 20 | Change | Dec 20 | Change |
Price | $3.18 | -$0.01 | $3.32 | $0.00 |
Support | $3.14 | -$0.01 | $3.29 | $0.00 |
Resistance | $3.20 | -$0.02 | $3.35 | $0.01 |
20 Day MA | $3.17 | -$0.01 | $3.33 | -$0.01 |
50 Day MA | $3.31 | -$0.05 | $3.45 | -$0.04 |
100 Day MA | $3.60 | -$0.04 | $3.68 | -$0.03 |
4-Week High | $3.31 | -$0.01 | $3.43 | -$0.02 |
4-Week Low | $3.09 | $0.00 | $3.29 | $0.04 |
Technical Trend | Down | = | Strong Down | = |
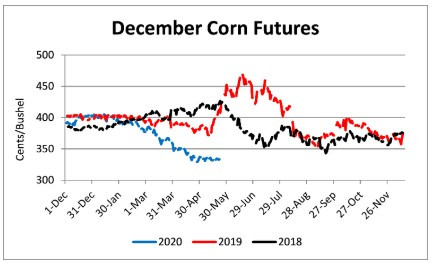
Nationally the Crop Progress report estimated corn planting at 80% compared to 67% last week, 44% last year, and a 5-year average of 71%; and corn emerged at 43% compared to 24% last week, 16% last year, and a 5-year average of 40%. In Tennessee, the Crop Progress report estimated corn planted at 79% compared to 67% last week, 83% last year, and a 5-year average of 91%; and corn emerged at 60% compared to 44% last week, 68% last year, and a 5-year average of 73%. In Tennessee, new crop cash corn contracts ranged from $3.04 to $3.32. September 2020 corn futures closed at $3.22, down 1 cent since last Friday. December 2020 corn futures closed at $3.32, unchanged since last Friday. Downside price protection could be obtained by purchasing a $3.40 December 2020 Put Option costing 25 cents establishing a $3.15 futures floor.
Soybeans
Net sales reported by exporters were up compared to last week with net sales of 44.3 million bushels for the 2019/20 marketing year and 17.0 million bushels for the 2020/21 marketing year. Exports for the same period were up 18% compared to last week at 18.4 million bushels. Soybean export sales and commitments were 74% of the USDA estimated total annual exports for the 2019/20 marketing year (September 1 to August 31), compared to the previous 5-year average of 97%. Average soybean basis strengthened or remained unchanged at Memphis, Northwest, and Upper-middle Tennessee and weakened at Northwest Barge Points. Basis ranged from 17 under to 25 over the July futures contract at elevators and barge points. Average basis at the end of the week was 12 over the July futures contract. July 2020 soybean futures closed at $8.33, down 5 cents since last Friday. For the week, July 2020 soybean futures traded between $8.28 and $8.49. Jul/Aug and Jul/Nov future spreads were 3 and 11 cents. August 2020 soybean futures closed at $8.36, down 4 cents since last Friday. July soybean-to-corn price ratio was 2.62 at the end of the week.
Soybeans | Jul 20 | Change | Nov 20 | Change |
Price | $8.33 | -$0.05 | $8.44 | -$0.01 |
Support | $8.22 | -$0.10 | $8.36 | -$0.04 |
Resistance | $8.44 | -$0.01 | $8.53 | $0.00 |
20 Day MA | $8.41 | -$0.01 | $8.48 | $0.01 |
50 Day MA | $8.52 | -$0.04 | $8.56 | -$0.03 |
100 Day MA | $8.88 | -$0.06 | $8.93 | -$0.06 |
4-Week High | $8.61 | $0.00 | $8.65 | $0.00 |
4-Week Low | $8.28 | $0.10 | $8.37 | $0.06 |
Technical Trend | Strong Down | - | Strong Down | - |
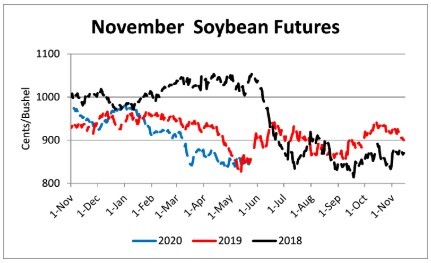
Nationally the Crop Progress report estimated soybean planting at 53% compared to 38% last week, 16% last year, and a 5-year average of 38% and soybeans emerged at 18% compared to 7% last week, 4% last year, and a 5-year average of 12%. In Tennessee, soybeans planted were estimated at 29% compared to 20% last week, 28% last year, and a 5-year average of 34% and soybeans emerged at 14% compared to 6% last week, 11% last year, and a 5-year average of 12%. In Tennessee, new crop soybean cash contracts ranged from $8.16 to $8.74. Nov/Dec 2020 soybean-to-corn price ratio was 2.54 at the end of the week. November 2020 soybean futures closed at $8.44, down 1 cent since last Friday. Downside price protection could be achieved by purchasing an $8.60 November 2020 Put Option which would cost 45 cents and set an $8.15 futures floor.
Cotton
Net sales reported by exporters were down compared to last week with net sales of 128,900 bales for the 2019/20 marketing year and 120,200 bales for the 2020/21 marketing year. Exports for the same time period were up 4% compared to last week at 252,200 bales. Upland cotton export sales were 109% of the USDA estimated total annual exports for the 2019/20 marketing year (August 1 to July 31), compared to the previous 5-year average of 103%. Delta upland cotton spot price quotes for May 21 were 55.31 cents/lb (41-4-34) and 57.56 cents/lb (31-3-35). Adjusted World Price (AWP) increased 0.65 cents to 48.01 cents. July 2020 cotton futures closed at 57.61 cents, down 0.64 cents since last Friday. For the week, July 2020 cotton futures traded between 57.06 and 59.85 cents. Jul/Dec and Jul/Mar cotton futures spreads were 1.12 cents and 0.2 cents.
Cotton | Jul 20 | Change | Dec 20 | Change |
Price | 57.61 | -0.64 | 57.81 | -0.36 |
Support | 56.48 | -0.16 | 56.67 | -0.08 |
Resistance | 58.78 | -0.88 | 59.37 | 0.06 |
20 Day MA | 56.73 | 0.77 | 57.68 | 0.37 |
50 Day MA | 54.93 | -0.38 | 56.29 | -0.38 |
100 Day MA | 61.91 | -0.63 | 62.46 | -0.58 |
4-Week High | 59.85 | 0.99 | 59.59 | 0.09 |
4-Week Low | 53.20 | 1.19 | 55.11 | 0.81 |
Technical Trend | Up | = | 0.00 | + |
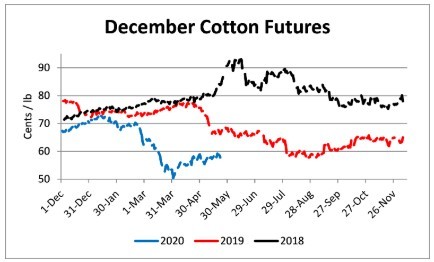
Nationally, the Crop Progress report estimated cotton planted at 44%, compared to 32% last week, 39% last year, and a 5-year average of 40%. In Tennessee, cotton planted was estimated at 23% compared to 10% last week, 46% last year, and a 5-year average of 53%. December 2020 cotton futures closed at 57.81, down 0.36 cents since last Friday. Downside price protection could be obtained by purchasing a 58 cent December 2020 Put Option costing 4.19 cents establishing a 53.81 cent futures floor. March 2021 cotton futures closed at 58.73 cents, down 0.14 cents since last Friday.
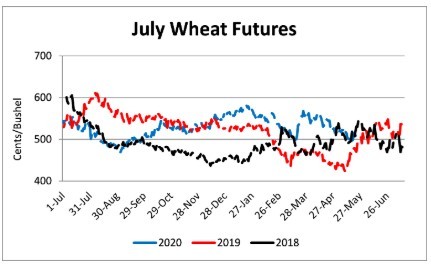
Wheat
Wheat net sales reported by exporters were up compared to last week with net sales of 6.5 million bushels for the 2019/20 marketing year and 9.3 million bushels for the 2020/21 marketing year. Exports for the same time period were unchanged from last week at 13.5 million bushels. Wheat export sales were 103% of the USDA estimated total annual exports for the 2019/20 marketing year (June 1 to May 31), compared to the previous 5-year average of 106%.
Wheat | Jul 20 | Change | Sep 20 | Change |
Price | $5.08 | $0.08 | $5.12 | $0.09 |
Support | $4.96 | $0.05 | $5.00 | $0.06 |
Resistance | $5.22 | $0.10 | $5.24 | $0.10 |
20 Day MA | $5.14 | -$0.09 | $5.17 | -$0.09 |
50 Day MA | $5.30 | -$0.01 | $5.33 | -$0.02 |
100 Day MA | $5.40 | -$0.03 | $5.45 | -$0.02 |
4-Week High | $5.52 | -$0.09 | $5.54 | -$0.10 |
4-Week Low | $4.93 | -$0.03 | $4.97 | -$0.03 |
Technical Trend | Down | + | Down | - |
Nationally the Crop Progress report estimated winter wheat condition at 52% good-to-excellent and 16% poor-to-very poor; winter wheat headed at 56% compared to 44% last week, 51% last year, and a 5-year average of 62%; spring wheat planted at 60% compared to 42% last week, 63% last year, and a 5-year average of 80%; and spring wheat emerged at 30% compared to 16% last week, 21% last year, and a 5-year average of 46%. In Tennessee, winter wheat condition was estimated at 61% good-to-excellent and 5% poor-to-very poor; winter wheat headed at 99% compared to 92% last week, 96% last year, and a 5-year average of 96%; and winter wheat coloring at 16% compared to 24% last year. In Tennessee, June/July 2020 cash contracts ranged from $4.80 to $5.40. July 2020 wheat futures closed at $5.08, up 8 cents since last Friday. July 2020 wheat futures traded between $4.93 and $5.24 this week. July wheat-to-corn price ratio was 1.60. Jul/Sept and Jul/Jul future spreads were 4 and 21 cents. September 2020 wheat futures closed at $5.12, up 9 cents since last Friday. September wheat-to-corn price ratio was 1.59. July 2021 wheat futures closed at $5.29, up 7 cents since last Friday. Downside price protection could be obtained by purchasing a $5.20 July 2021 Put Option costing 37 cents establishing a $4.83 futures floor.
Source : tennessee.edu