By Bradley Zwilling, Brandy Krapf, and Dwight Raab
Illinois FBFM and Department of Agricultural and Consumer Economics
University of Illinois
In the original article (see farmdoc daily, February 20, 2015) we looked at the ten-year period from 2004 to 2013, which saw higher crop prices, higher costs, and greater expense election limits. In this article, we will add the what’s and when’s of capital purchases from 2014 to 2017. This is period of lower incomes but with continued higher levels for the expense election limit. What have these changes done to capital purchases? To determine this, we looked at capital purchases made by farms enrolled in Illinois Farm Business Farm Management (FBFM) from 2004 to 2017. This study contains all types of entities, but the purchases are based on the calendar year when they were acquired, not the entities fiscal year. For this study, we are defining capital purchases as items purchased to be used by the farm business and that fall into two categories, buildings or machinery.
What Is Being Purchased?
For buildings, the top three assets purchased are field tile, grain and feed bins and machine sheds. Tile was thirty-four percent of the total number of building purchases while bins and machine sheds were fourteen and eleven percent, respectively. When looking at tile as a percent of total building purchase, it has been increasing. The average for the period from 2004 to 2008 was twenty-seven percent. This increased to thirty-six percent for the period from 2009 to 2013. From 2014 to 2017, the average is thirty-nine percent. When looking at these same periods of time for grain bins and machine sheds, we see that machine sheds have not changed much, however the percent for the number grain bins purchased has be decreasing.
Figure 1 contains the top five machinery purchases by number of purchases. The other group includes assets that do not fit into the defined descriptions such as GPS equipment, seed tenders, header carts, conveyors and farm utility vehicles. The other group has declined since 2013 because FBFM add more asset categories so those purchases can be now broken out with better detail. Tractors averaged eleven percent of the total number of machinery purchases from 2004 to 2017. However, when broken into periods of 2004 to 2008, 2009 to 2013 and 2014 to 2017, the percentages are 11, 13 and 9 respectively. When we look at the top 5 asset purchased by dollars purchased, the top three assets are tractors, combines and heavy general purpose trucks in that order.
When Are Purchases Being Made?
First, let’s look at purchases by quarter. Figure 2 shows the number of purchases as a percent of the total by quarter. The graph shows three multi-year averages, one for 2004 to 2008, another from 2009 to 2013 and one from 2014 to 2017. The 1st quarter had the largest number of purchases in the first five-year average at twenty-nine percent. However, the 4th quarter had the largest number of purchases for the other two multi-year averages at twenty-nine percent and twenty-seven percent, respectively. The 2nd and 3rd quarters stayed the same for the number of purchases. The trend went from having more capital purchases in the first quarter for the period of 2004 to 2008 to having the most capital purchases in the last quarter for the period of 2009 to 2013. However, for the last four-year period of 2014 to 2017 they are now trending to be similar for all four quarters.
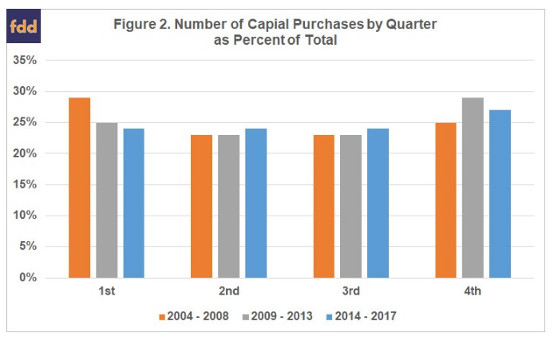
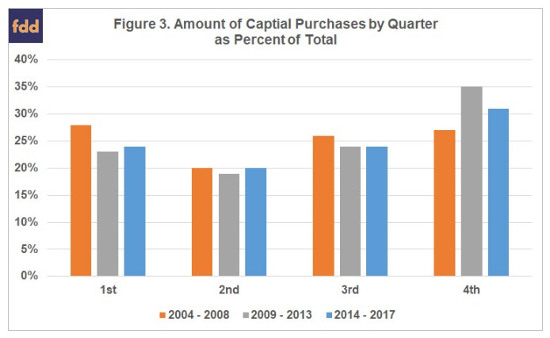
Figure 3 shows the total amount spent on capital purchases by quarter. We see a similar trend moving from more amount of purchases in the first quarter to more in the fourth quarter to now a leveling of the amount of purchases as it was in Figure 2. The 1st quarter went from twenty-eight percent of the amount of purchases to twenty-three percent then back to twenty-four percent, while the 4th quarter went from twenty-seven percent to thirty-five percent then back down to thirty-one percent. The trend was more significant in the 4th quarter when we looked at the amount spent on purchases.
When looking at capital purchases by month based on number of purchases, December has the greatest number of purchases from 2004-2017. Thirteen percent of the number of purchases made were in December while January and March account for 10% each. December is when many farmers are estimating their income tax liability, and some of these purchases could be due to optimizing their tax liability. January and March also have larger number of purchases. January’s higher number of purchases may be partially due to the largest percentage of the corn and soybean crop being sold during this month (a little more than twenty percent on a fourteen-year average).
Summary
From 2004 to 2017, we have seen many changes in agriculture. These changes have not had a large impact on the types of items most frequently purchased by farms enrolled in Illinois Farm Business Farm Management. The top purchases were the same in 2004 as they were in 2017. However, when we look at when the capital purchases are made, we see some changes. From 2014 to 2017, capital purchases are leveling back out but with the larger amount of purchases still being made in the last quarter of the year. Over the time period of this study, December has primarily been the month with the highest number of purchases as well as the highest amount spent on purchases. Some of the reasons for the increase in the period from 2009 to 2013 are higher farm incomes and increasing of the expense election to $500,000 for every year since 2010. The higher expense election has allowed capital purchases to be utilized at the year-end to help farmers optimize their income tax liability. However, from 2014 to 2017, we have had lower incomes, but the amount and number of purchases in the last quarter of the year only decreased slightly even though the expense election amount stayed the same.
The author would like to acknowledge that data used in this study comes from the local Farm Business Farm Management (FBFM) Associations across the State of Illinois. Without their cooperation, information as comprehensive and accurate as this would not be available for educational purposes. FBFM, which consists of 5,600 plus farmers and 60 professional field staff, is a not-for-profit organization available to all farm operators in Illinois. FBFM field staff provide on-farm counsel with computerized recordkeeping, farm financial management, business entity planning and income tax management.