By Bradley Zwilling
During volatile times in agriculture due to changes in crop prices and costs, working capital, “cash”, is your friend. Working capital is the result of subtracting current liabilities from current assets. Current assets are bank accounts, crop inventories, prepaids, stock and hedging accounts, and other current items. Current liabilities include accounts payable, operating loans, accrued interest and current portion due of intermediate and long-term loans. With working capital, a farm can adjust to adversity such as a drought, lower prices, and rising interest rates and crop inputs. Also, one can position themselves to make down payments for capital purchases such as land, machinery or even a new home. How much working capital do I need? That is hard to answer in absolute terms as it differs by size, type, age and goals of each farm family. However, by using ratios, you can measure your working capital as a percentage. With these ratios, one can benchmark to their peers as well as monitor their trend over-time. Two common ratios are working capital to gross farm returns and working capital to operating expenses. Each use a component of net farm income as a measuring stick for working capital.
Volatility in Earnings
Figure 1 shows the average return to the operator’s labor and management income adjusted for inflation from 1972 to 2021. Average return to operator’s labor and management can be thought of as the farmer’s “wage” or “salary”. This is what remains from the operator’s net farm income after a fair return to the operator’s equity in machinery and land has been subtracted. We will use the standard deviation to measure volatility as it measures the difference of earnings from the average of the period.
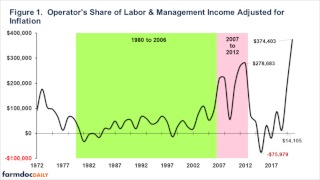
The standard deviation for the entire period in the chart is $86,348. The green area in Figure 1 (1980-2006) was a relatively stable period for earnings with a standard deviation of $33,523. The pink area (Figure 1) was the run up in prices starting with the ethanol mandate with a standard deviation of $80,508. The final period in Figure 1 has been the most volatile with a standard deviation of $133,365. Therefore, using this most recent period of time, 2023 can potentially change $130,000 from the average earnings of the period from 2013 to 2021. Thus, working capital is needed as a “safety net” to draw on when cash flows are short or lower earnings.
Working Capital Ratios
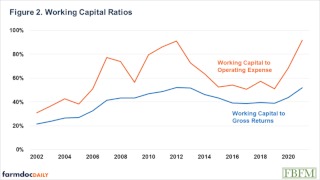
In Figure 2, the average working capital ratios are shown from 2002 to 2021 for the average Illinois grain farm enrolled in Illinois Farm Business Farm Management (FBFM). Working capital to gross returns has ranged from about 20% to about 55% while working capital to operating expenses has ranged from about 30% to about 90%. Why is there so much difference in ranges for these two working capital ratios? Typically, as gross returns increase so does working capital, so they move in tandem and little change to the overall ratio, thus less variability during this time frame, but on average has been increasing. On the other hand, working capital to operating expense is much more variable, because when working capital increases, operating expense tend to not increase as much. Also, when operating expenses experience a larger increase, gross farm returns may or may not increase at the same rate, thus working capital could go up or down. Working capital to operating expenses has been increasing over time, but grain farms were using some of their working capital during the 2015-to-2019-time frame, which was a period of lower overall returns. A 40% working capital to gross returns ratio means that you have enough “cash” to replace 40% of your gross returns in that year. A 60% working capital to operating expense ratio is interpreted as the farm has enough “cash” to pay for 60% of that years operating expenses without having any other income. A strong working capital to gross returns ratio for a grain farm would be 30%. 50% would be a good working capital to operating expense ratio for a grain farm.
Source : illinois.edu