U of G researchers share findings on changes in Ontario fertilizer applications since 1971
Nicholas Bannon and Alfons Weersink
Department of Food, Agriculture and Resource Economics
University of Guelph
Fertilizer use in agriculture is under increasing scrutiny largely due to environmental concerns associated with emissions into the air (nitrous oxide) and the water (nitrates and phosphates).
Algae blooms in Lake Erie are an example of the effects of excess nutrient runoff and the concerns have sparked the creation of initiatives such as the 4R nutrient management program in Ontario.
In this article, we explore if a change has occurred in the area of Ontario cropland receiving fertilizer applications since 1971.
The amount of cropland in Ontario has remained relatively constant at around 9 million acres for the last two decades. (See Figure 1.) The province even had a slight increase in this acreage between 1991 and 2001.
Figure 1: Ontario cropland acreage receiving inorganic fertilizer and manure applications, 1991 to 2016
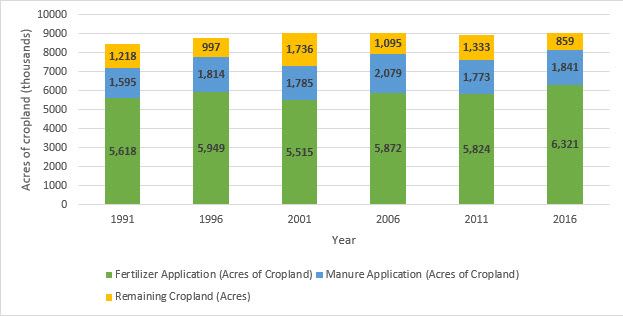
Farmers applied inorganic fertilizer on just over 6.3 million acres of Ontario cropland, Statistics Canada’s 2016 Census of Agriculture revealed. (See the green bars in Figure 1.) That figure represents 70 per cent of Ontario cropland and this percentage is just slightly higher than the average share of cropland on which farmers applied fertilizer over the last 35 years. The share has been consistent since the increase from 35 per cent to 70 per cent between 1971 and 1981 that coincided with the increase in Ontario corn acreage.
In addition to inorganic or commercial fertilizer, nutrient leaching and runoff can be associated with the application of organic fertilizer or manure. In 1991, Statistics Canada began collecting data on the area of cropland on which farmers applied manure.
In 2016, producers spread manure on 1.84 million acres of Ontario cropland. (See Figure 1.) This acreage represented 20 per cent of the total cropland and this share has been relatively constant since 1991.
Thus, the share of cropland receiving fertilizer in the form of either inorganic and organic fertilizer has remained relatively constant since 1991.
What does this information mean in terms of nutrient run-off and water pollution?
Since the total area of application of fertilizer and manure has not changed significantly for over 25 years, one could predict that the amount of nutrient run-off occurring today should be like what was observed 25 years ago. However, with growing concern around the water pollution in Ontario’s Great Lakes, it does not appear that this situation is the case.
Although the total acreage with fertilizer application has stayed constant province-wide, individual counties have experienced more significant changes in the acreage with fertilizer applications. These shifts could be contributing factors in the increase in water contamination in the Great Lakes.
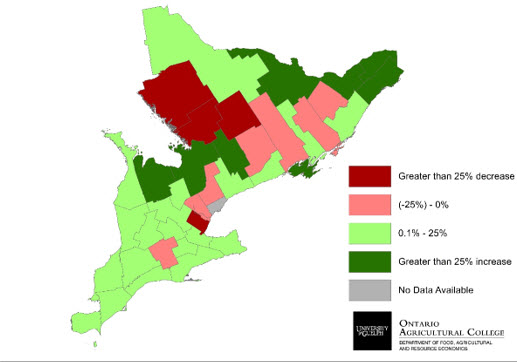
Figure 2 maps the changes in fertilizer applications by county since 1991. The largest increases are in regions where corn and soybean production have expanded. Increases in cropland area receiving fertilizer application also occurred in all counties bordering Lake Huron and Lake Erie, which could explain why large algae blooms have become more frequent.
Figure 2: Percentage change in Ontario cropland acreage receiving fertilizer by county, 1991 to 2016
In summary, two-thirds of Ontario cropland receives inorganic fertilizer and one-fifth receives manure. These figures were relatively constant over the last 25 years, as was the cropland acreage.
Note that the acreage on which farmers applied fertilizer does not reflect the amount of fertilizer applied. Rather, the numbers in the first figure simply reflect the increase in total cropland acreage with fertilizer applications, regardless of application rates.
Estimating fertilizer usage amounts can be difficult, as relevant data is limited. We will explore this topic in future articles and blogs. It will be interesting to see whether changes in fertilizer rates have followed a similar pattern as the changes in the acreage of fertilizer application, and whether initiatives such as the 4Rs have caused any changes in the industry.
National Pork Board and the Pork Checkoff, Des Moines, Iowa, U.S. photo