By Gary Schnitkey and Jim Baltz et.al
Department of Agricultural and Consumer Economics
University of Illinois
Carl Zulauf
Department of Agricultural, Environmental and Development Economics
Ohio State University
Harvest prices for 2022 crop insurance products are $6.86 per bushel for corn and $13.81 for soybeans. Those harvest prices will generate few 2023 insurance payments across Illinois, and much of the Midwest, as reports indicate good yields. We provide 2023 break-even yields as a percent of guarantee yields for coverage levels on Revenue Protection (RP). Harvest prices and current levels of futures contracts suggest relatively high 2023 projected prices, reducing the chance of declines in crop insurance guarantees in 2023. In the future, projected prices could decline by over 20%, causing insurance guarantee declines, like what occurred between 2013 and 2015. We begin this discussion by providing background on projected and harvest prices.
Background on Projected and Harvest Prices
Projected and harvest prices are integral for revenue crop insurance offered by the Federal government. These prices are used to set revenue guarantees and determine crop insurance payments. The most used crop insurance product for corn, soybeans, and wheat is Revenue Protection (RP), a revenue product whose guarantee increases if the harvest price is above the projected price. RP is used on over 90% of the corn, soybeans, and wheat acres insured in Illinois (see farmdoc daily, November 17, 2020). Therefore, we focus on RP insurance in this article.
For RP, the revenue guarantee is
The guarantee yield usually is the trend-adjusted Actual Production History (APH) yield. Limits are placed on the harvest price increase such that the harvest price can not be more than two times the projected price. To illustrate the revenue guarantee, take an 85% coverage level, a 220 bushel per acre guarantee yield, a $5.90 projected price, and a $6.86 harvest price (see Figure 1). The RP revenue guarantee is $1,283 per acre (.85 x 220 x $6.86). Note that the higher $6.86 harvest price is used in the calculation.
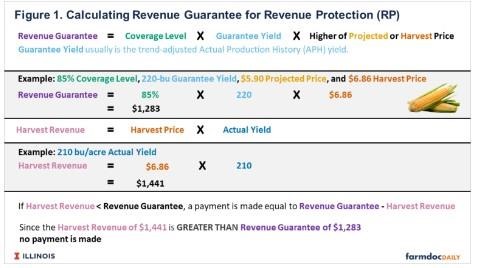
Harvest revenue then equals
If harvest revenue is below the guarantee, a payment is made equal to the guarantee minus the harvest revenue. Take a yield of 210 bushels in the above example. Harvest revenue is $1,441 per acre (210 yield x $6.86 harvest price), above the $1,281 guarantee, resulting in no payment. When the harvest price is above the projected price, payments will only occur if the yield falls below the coverage level times the guarantee yield. In the above example, crop insurance payments will occur below 187 bushels per acre (.85 coverage level x 220 guarantee yield).
Both the projected and harvest prices are based on settlement prices of Chicago Mercantile Exchange (CME) products. Commodity Exchange Price Provisions (CEPP) list details of exchanges and dates for determining the projected and harvest prices. Those provisions vary by crop and state (see here for corn, and here for soybeans). In the following, we describe provisions applicable to Illinois. The same provisions apply to 31 states for corn and 25 for soybeans, including all states within the Midwest.
For corn, the December contract is used to set both projected and harvest prices. The 2022 December contract is used for 2022, and the 2023 December contract will be used in 2023. The average of settlement prices during February is used to set the projected price. At the end of February, a minimum revenue guarantee is known for RP, which equals the coverage level times the guarantee yields times the projected price. The guarantee can increase if the harvest price is above the projected price. The average of settlement prices during October is used to set the harvest price.
For soybeans, the November CME contract is used. The 2022 November contract is used for 2022, and the 2023 November contract will be used in 2023. The average of settlement prices during February is used to set the projected price, leading to a minimum revenue guarantee for RP. The average of settlement prices during October is used to set the harvest price.
2022 Projected and Harvest Prices
For 2022, the projected price for corn is $5.90 per bushel, and the harvest price is $6.86 per bushel. The harvest price is above the projected price, and the revenue guarantee will reset using the higher harvest price. As a result, RP insurance payments will only occur once the actual yield is below the coverage level times the guarantee yield (see Table 1). In the above example with a 220 guarantee yield and an 85% coverage level, insurance payments will trigger below 187 bushels per acre.
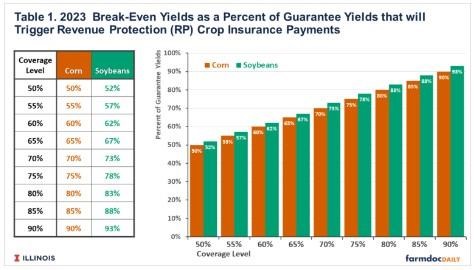
For 2022, the projected price for soybeans is $14.33, and the harvest price is $13.81. The harvest price is 96% of the projected price. We calculated the break-even yield as a percent of guarantee yield (see Table 1). For an 85% coverage level, actual yield needs to be lower than 88% of the guarantee yield. If a farm has a 65 bushels per acre guarantee yield, yield needs to be below 57.2 bushels per acre before a crop insurance payment is triggered for soybeans at an 85% coverage level.
Reports indicate that yields are good across much of Illinois, suggesting limited payments for corn and soybeans. Drought conditions in Iowa and the Great Plains suggest that larger payments may occur in those regions of the country.
When purchasing RP, some farmers also purchased Supplemental Coverage Option (SCO) and Enhanced Coverage Option (ECO), addons to RP and other individual farm products. SCO and ECO provide a county guarantee from the coverage level of the underlying product up to 86% (SCO) and 90% or 95% (ECO). Given an underlying RP product, ECO at the 95% coverage level will trigger payments for soybeans when the actual county yield is 98% of the county’s expected yield. For soybeans, the 90% coverage level county yields will have to be below 93% of the expected county yield. Given an underlying RP product, ECO at the 95% coverage level will make payments for corn when county yields fall below 95% of expected yields. For corn, the trigger is 90% of the expected yield for the 90% coverage level.
Payments on ECO and SCO will not be known until June 2023, when county yields are released by the Risk Management Agency. SCO and ECO payments are likely in some counties with lower yields, particularly for soybeans.
Recent History of Projected and Harvest Prices
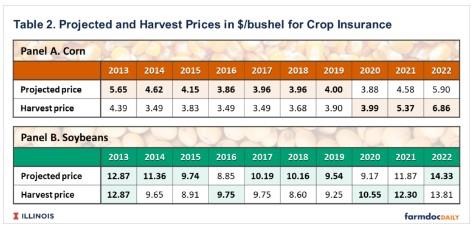
Table 2 shows corn and soybeans’ projected and harvest prices since 2013. Note that projected prices were relatively low from 2015 to 2020 when projected prices averaged $3.97 for corn and $9.61 for soybeans. Since 2020, prices have risen, resulting in higher projected and harvest prices. For example, projected prices for corn were $4.58 for 2021 and $5.90 for 2022, compared to the $3.97 average from 2014 to 2020. For soybeans, projected prices were $11.87 in 2021 and $14.33 in 2022, compared to the $9.61 average for 2015 to 2020.
Revenue crop insurance products provide excellent intra-year protection for revenue. Declines in harvest prices due to adverse supply and demand conditions have the potential to generate RP crop insurance payments. Similarly, RP provides protection against low yields.
RP provides much less coverage when prices decline across the years. Future contracts reflect market conditions, changing quickly with changes in supply and demand. In the future, projected prices will fall, resulting in lower crop insurance guarantees. Take 2013 to 2015 as an example. The projected price in 2015 was $4.15 per bushel, a fall of 26.5% from the $5.65 level in 2013 (see Table 2). With no changes in coverage level or guarantee yield, the per acre crop insurance guarantee would fall by 26.5%. A 26.5% decline from the $5.90 projected price in 2022 would result in a $4.44 projected price. For the above example, this decline would result in a minimum revenue guarantee moving from $1,103 per acre (.85 x 220 x $5.90) to $810 per acre.
For soybeans, the 2015 projected price was $9.74 per bushel, 24.3 percent lower than the $12.87 projected price in 2013. An individual with an 85% coverage level, 65-bushel guarantee yield, and a $14.33 projected price has a 2022 guarantee of $791. A 24.3% fall in projected price results in a $10.84 projected price and a $599 per acre guarantee.
Those guarantee decreases would put farmers much more at risk. Most farmers already take RP at a high coverage level, so coverage levels could not be increased. Given the large increase in per acre costs, risk would be higher.
2023 Projected Prices
Still, 2023 projected prices likely will be relatively high. The 2022 harvest prices provide reasonable indications of 2023 projected prices. We fit relationships that explained next year’s projected price based on the previous year’s harvest price. From 1973 to 2022, the linear relationships explained 78% of the variability for corn and 84% for soybeans.
For corn, the 2022 harvest price suggests a $6.30 harvest price (.79 + .80 x $6.85 harvest price). Given the fitted regression, 50% of the time, the 2023 projected price will be between $5.88 and $6.53. Moreover, current prices of the 2023 December corn contract are near $6.20, consistent with the projection from the fitted historical model.
For soybeans, the 2022 harvest price suggests a $13.56 projected price for 2023 (.63 + .94 x $13.80 harvest price). Given the fitted relationship, 50% of the time, the 2023 projected price will be between $11.72 and $15.40. Currently, the 2023 November soybean contract is near $13.70, consistent with the projection from the fitted historical model.
Summary
Harvest prices in 2023 are $6.85 per bushel for corn and $13.80 per bushel for soybeans. These prices likely will generate limited crop insurance payments in 2023 within Illinois. However, larger payments could occur outside Illinois, particularly in the western Corn Belt and Great Plains.
Overall, the outlook is for high 2023 projected prices: above $6.00 per bushel for corn and near mid-$13 per bushel for soybeans. Prices at those levels would provide significant risk protection for farmers and would avoid the decline in projected prices that occurred between 2013 to 2015.
Still, there are risks concerning the levels of 2023 projected prices. World events could cause changes in prices even before the February period in which corp insurance prices are determined.
Source : illinois.edu