By Bradley Zwilling
Illinois FBFM Association and Department of Agricultural and Consumer Economics
University of Illinois
Agricultural debt on a nominal basis in Illinois has been increasing since 1991. Data from the U.S. Department of Agriculture (USDA) and Illinois Farm Business Farm Management (FBFM) are shown to see if increasing debt levels pose problems for the financial health of Illinois farms. With the continued tighter margins and more variability in the farm economy, increasing debt levels need to be monitored closely.
Overall Agricultural Debt Levels
USDA publishes estimates of total agricultural debt outstanding in the United States (see Economic Reporting Service, USDA website). This series is available from 1960 onwards and gives the amount of agricultural debt outstanding as of the year-end.
Nominally, agricultural debt reached a peak in 1984 of $188.8 billion (see the nominal line in Figure 1). From 1984 through 1989, agricultural producers retired debt and agricultural lenders wrote off some debt, resulting in a decline in total debt. By 1989, agricultural debt had declined by 31%, reaching a level of $131 billion.
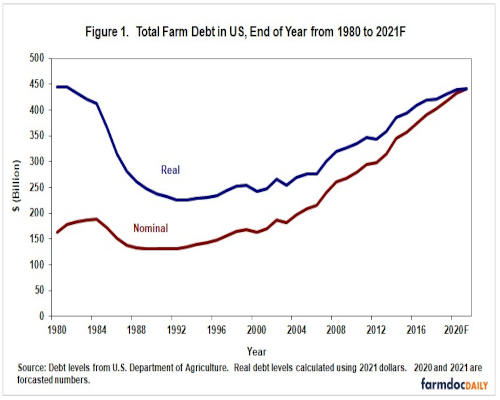
Since 1990, agricultural debt increased an average of 3.9% per year. The rate of increase varied from year-to-year but exhibited no escalating or decreasing trends. The highest rate increases occurred between 2006-2007 and 2013-2014 when increases were 11.6 and 9.5%, respectively. Increases of less than 3% occurred nine times in this period while decreases happened in 3 years with the greatest at negative 3.2% in 2002-2003.
At the end of 2004, agricultural debt reached $197.6 billion, surpassing the previous high set in 1984. Increasing debt levels may cause concerns that financial stress occurring during the 1980s may repeat. However, the above debt levels are stated in nominal terms and do not take into consideration inflation’s devaluing impacts on the dollar.
Using the gross national product – implicit price deflator to state nominal debt levels in terms of 2021 dollars gives a different picture of debt levels (see the real line in Figure 1). In terms of 2021 dollars, agricultural debt started at $421 billion in 1980 before declining until 1994. Since 1993, agricultural debt in real terms increased all but three years 2000, 2003, and 2012. Since 1990, the rate of increase averaged 1.9% for real debt levels, much lower than the 3.9% nominal rate increase. The forecasted numbers for 2020 and 2021 are the highest levels in real terms since 1981.
Debt Levels on FBFM Grain Farms
Additional perspective on debt can be obtained by analyzing farm level data from FBFM. Table 1 presents average data for grain farms enrolled in FBFM who have certified-useable balance sheets. The data is stated in nominal terms, and debt levels are stated as of year-end 1991 through 2019. Three measures of debt level are presented in Table 1: debt-to-asset ratio, debt per tillable acre, and interest expense per tillable acre.
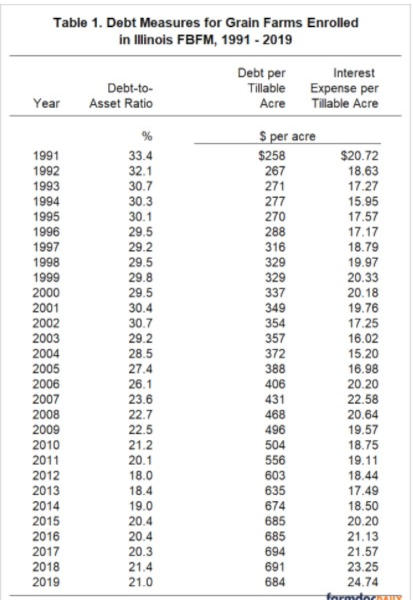
The debt-to-asset ratio had a very slight downward trend from 1993 to 2002. In 1993 and 2002, the debt-to-asset ratio was 30.7% and 30.7%, respectively. From 2003 to 2012, the debt-to-asset ratio decreased at a faster pace, averaging 5.2%. In 2003 and 2012, the debt-to-asset ratios were 29.2% and 18.0%, respectively. Since 2012, the debt-to-asset ratio has increased 2.3% annually. Since 1991, both asset and liability levels rose, with asset levels increasing slightly faster than debt levels.
Increases in debt can be seen by examining debt per tillable acre. Debt levels were $258 per tillable acre in 1991 compared to $357 in 2003, an increase of almost $100 per acre (see Table 1). Since 2003, debt levels per tillable acre increased more than $300 per acre. Between 1991 and 2003, debt per tillable acre increased an average of 2.8%, which is about equal to the 2.7% for all U.S. agricultural debt. However since 2003, Illinois FBFM grain farms debt per tillable acre increased 4.2%, lower than the national average of 5.1%. Some of the difference could be increase in acres faster than the increase in debt on Illinois grain farms.
While debt levels have increased, interest expense per tillable acre declined from 1999 to 2013, except for 2005, 2006, and 2007 which saw double-digit increases of 11.7%, 18.9% and 11.8%, respectively as well as 2.0% in 2011. Interest per tillable acre has been increasing since 2013. Interest expense was $20.72 per tillable acre in 1991 and $18.63 in 1992, while in 2018 and 2019 interest expense per tillable acres was $23.25 and $24.74, respectively. Lower interest rates in the late 90s and early 2000s caused the reduction in interest expense per tillable acre in the face of rising debt levels per acre. However, an interest rate increase in the mid-2000s caused an increase in interest expense per tillable acre during that period. From the mid-2000s until 2013, interest rates have decreased, but the amount of debt was increasing more rapidly. Interest rates, as well as debt, has begun to increase since 2013, leading to interest expense per tillable acre to increase on average 6.0% per year.
Summary
The importance a farmer puts on monitoring their debt level continues to be increasingly important in this period of lower margins. With higher inputs and variability, we will continue to see the increase in debt per acre. With interest rates moving higher, this mean a rising interest expense as well. Also, with some farm assets decreasing in value, this can also lead to higher debt-to-asset ratios even without any additional debt. Finally, as debt levels increase, farmers need to monitor their term debt ratio. The greater the number, the greater the margin to meet all term debt payments. A ratio of one means that income available is equal to the term debt payments. In 2018, the average for the 2,483 Illinois farms enrolled in FBFM with useable data was 2.44 compared to 1.16 in 2017. Establishing or maintaining good recordkeeping during these times will help farmers identify areas of concern faster and be able to make better farm financial decisions.
The author would like to acknowledge that data used in this study comes from farms across the State of Illinois enrolled in Illinois Farm Business Farm Management (FBFM) Association. Without their cooperation, information as comprehensive and accurate as this would not be available for educational purposes. FBFM, which consists of 5,500 plus farmers and 65 professional field staff, is a not-for-profit organization available to all farm operators in Illinois. FBFM field staff provide on-farm counsel with computerized recordkeeping, farm financial management, business entity planning and income tax management. For more information, please contact the State Headquarters located at the University of Illinois Department of Agricultural and Consumer Economics at 217-333-8346 or visit the FBFM website at www.fbfm.org.
Source : illinois.edu