By Scott Irwin
Department of Agricultural and Consumer Economics
University of Illinois
It is widely acknowledged that the U.S. ethanol industry has been negatively impacted by the COVID pandemic. The plight of ethanol producers has prompted calls for financial relief from the Federal government (Neely, 2020a). The latest aid package for the economy passed by the U.S. Senate, the Heals Act, provides $20 billion in additional support for agricultural producers and processors, at the discretion of the Secretary of Agriculture. The amount of any aid will be presumably tied to the financial losses experienced by an agricultural processing industry, such as ethanol producers. Some have estimated in the losses in the billions (Neely, 2020b), but this has been disputed by others (Glauber, 2020). The purpose of this article is to estimate the production profits of ethanol plants before and after the COVID-19 lockdowns that began in March of this year. This will help improve understanding of the financial consequences of the COVID-19 pandemic for the U.S. ethanol industry.
Analysis
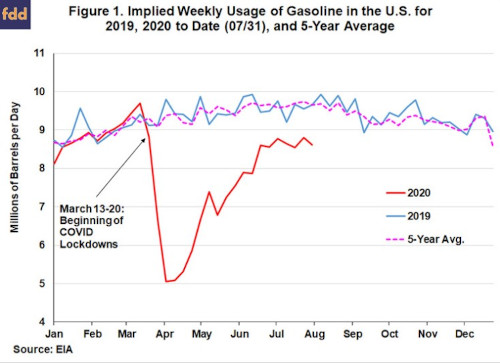
We begin by reviewing the impact of the COVID pandemic on gasoline use in the U.S. This is the main driver of ethanol use and hence a logical place to start the analysis. Figure 1 shows (implied) weekly gasoline use in the U.S. for 2019, 2020 to date (through July 31st) and the five-year average for comparison. The impact of the COVID lockdowns is seen in the “swoosh” pattern of sharp decline, quick recovery, and then a longer period of slower recovery. More specifically, gasoline use dropped 48 percent between March 13th and April 3rd, recovered sharply into mid-May, and has leveled out about 11 percent below year ago levels in recent weeks.
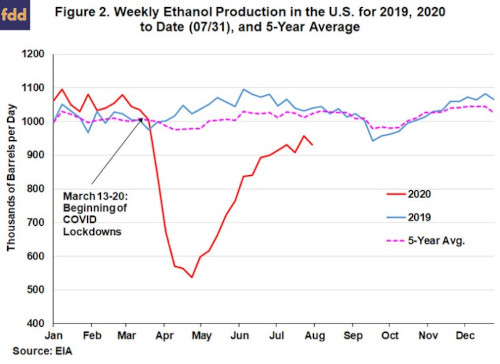
Not surprisingly, the impact of the COVID lockdowns on ethanol use and production closely mirrored that of the gasoline market. Figure 2 shows weekly ethanol production in the U.S. for 2019, 2020 to date (through July 31st) and the five-year average. The swoosh pattern is clearly in evidence, with ethanol production declining 48 percent between March 13th and April 24th, exactly the same as the decline in gasoline use. The only difference is that the bottom in ethanol production occurred two weeks after the bottom in gasoline use.
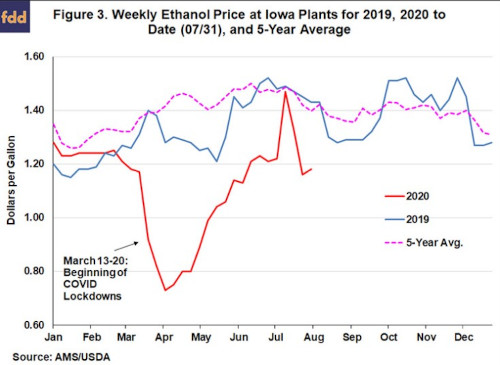
As would be expected, the impact of the drop in gasoline demand on ethanol prices was substantial. Figure 3 shows the weekly price of ethanol at Iowa plants for 2019, 2020 to date (through July 31st) and the five-year average. Note that ethanol prices in January and February 2020 were about the same as in 2019 and the level of the five-year average. The initial decline in ethanol prices was quite severe, dropping 62 percent between March 13th and April 3rd. The subsequent recovery in ethanol prices was also substantial, with prices actually briefly exceeding the pre-COVID levels in mid-July. Ethanol prices in the latter part of July receded closer to pre-COVID levels. Overall, the COVID lockdowns resulted in the same basic swoosh pattern in ethanol prices as was shown earlier for gasoline use (Figure 1) and ethanol production (Figure 2).
With this background, we can now consider the pattern of ethanol production profits during the pandemic. The profitability estimates are based on the same basic model of a representative Iowa ethanol plant that has been used in earlier farmdoc daily articles. See the article from
January 29, 2020 for details on the latest assumptions built into the model. Figure 4 presents (pre-tax) estimates of ethanol production profits net of all variable and fixed costs for 2019, 2020 to date (through July 31st) and the five-year average. It is important to emphasize that the profit estimates in Figure 4 apply to operating ethanol plants only. As noted previously, nearly half of U.S. ethanol production was shut down after March 13 for a period of at least several weeks.
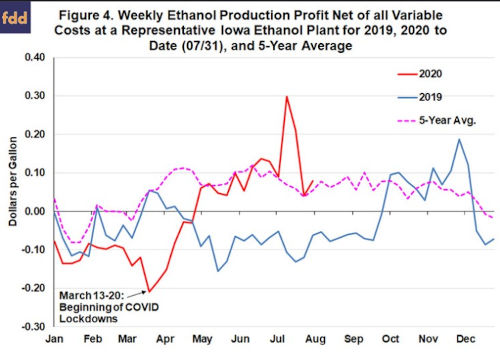
It is interesting to observe how the pattern of ethanol production profits differs from the swoosh pattern observed earlier for gasoline use, ethanol production, and ethanol prices. Previous to the COVID lockdowns, ethanol plants in 2020 were operating at a loss, which averaged -$0.11 per gallon. After the COVID lockdowns, plants still in operation averaged a profit of $0.04 per gallon. Clearly, profits would have turned into massive losses if half of ethanol production capacity had not been shuttered. Nonetheless, it is noteworthy how quickly the part of the industry that remained in operation was able to return to profitability and in mid-July even reached some of the highest profit levels of the last five years.
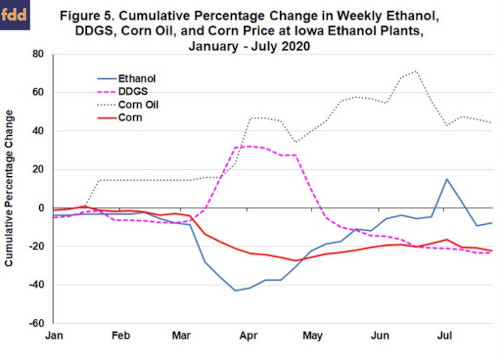
An obvious question is how operating ethanol plants were able to return to profitability so quickly. The answer is found in Figure 5, which shows the price of ethanol, DDGS, corn oil, and corn at Iowa ethanol plants to date in 2020. The initial sharp drop in ethanol prices after the lockdowns was partially offset by dramatic increases in the price of DDGS and corn oil, by-products of ethanol production. Corn oil prices continued to rise through July, while DDGS prices declined back to pre-COVID levels by early May. Then in May ethanol prices began to recover faster than corn prices, the main input cost for producing ethanol, even exceeding pre-lockdown prices briefly during July. The net effect of these output and input price movements was to restore profitability for operating ethanol plants quicker than most expected.
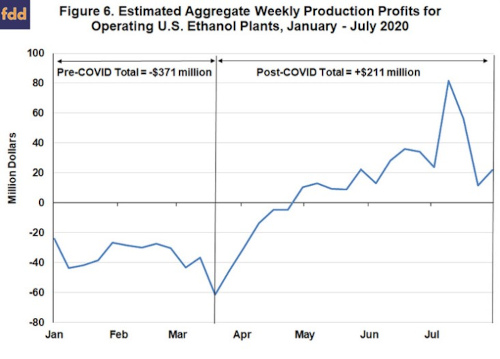
As noted above, the per gallon profits presented in Figure 5 strictly apply only to a single operating ethanol plant. In order to gain a better picture of aggregate profits and losses for the all ethanol plants in operation, we multiply the weekly production volumes in Figure 2 by the estimated weekly profits per gallon in Figure 4. The result of this computation is an estimate of aggregate profits/losses for all operating ethanol plants in the U.S. during 2020. Figure 6 shows that operating ethanol plants as a group had large losses in the pre-COVID lockdown period of 2020, estimated to total -$371 million. In contrast, operating ethanol plants post-COVID lockdown actually had a modest profit of $211. While perhaps surprising to some, the computed profit for the post-COVID period makes sense given the price trends shown in Figure 5.
It is also important to recognize that the above profit computation for the ethanol industry during the post-COVID lockdown period of 2020 is incomplete because it does not take into account the fixed costs incurred by shuttered ethanol plants or the costs of shutting down those plants. It also does not incorporate additional costs incurred by ethanol plants to remain in operation due to COVID-19. We can make reasonable estimates of the fixed costs incurred by shuttered ethanol plants based on our model of a representative plant. We make two assumptions for fixed costs: i) $0.15 per gallon for plants with no construction debt, and ii) $0.21 per gallon for plants with construction debt. We also assume that shutdown costs for an ethanol plant are $500,000 and that 105 of the 210 plants (half) listed by the
Renewable Fuels Association were shutdown at some point during the COVID lockdown period. This estimate of shutdown costs is based on conversations with contacts in the ethanol industry. We do not have any data on additional costs incurred by operating ethanol plants during the post-COVID period and that should be kept in mind when viewing the profit/loss estimates.
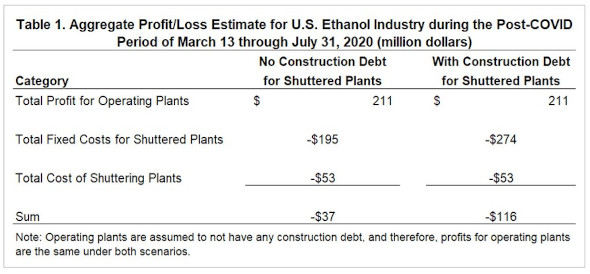
Table 1 provides the estimates of the profit/loss of the U.S. ethanol industry during the post-COVID lockdown period, assumed to be March 13 through July 31, 2020. The total profit for operating plants is $211 million, the same as shown earlier in Figure 6. Fixed costs for shuttered ethanol plants during this period are estimated to total $195 million or $274 million, depending on whether plants are assumed to have construction debt or not. The total cost of shuttering 105 plants is $53 million (105 plants X $500,000 per plant). The sum of these three categories provides an estimate of the aggregate loss of the ethanol industry, and it ranges from -$37 million to -$116 million, depending of the scenario. It is surprising, even after taking into account the fixed costs of shuttered ethanol plants and the costs of closing the plants, that the losses for the ethanol industry are substantially smaller post-COVID than what the industry experienced pre-COVID. It is important to remember that these are only rough estimates of the aggregate losses of the ethanol industry post-COVID. Nonetheless, it seems unlikely that the additional costs incurred by operating ethanol plants due to COVID precautions would drive losses post-COVID to the pre-COVID level.
Implications
The financial impact of the COVID pandemic on the U.S. ethanol industry is a much-discussed question at the present time. We investigate this issue and show that the ethanol industry experienced a relatively large total loss of nearly -$400 million in the early months of 2020 before the COVID lockdowns hit. Surprisingly, plants that remained in operation after the COVID lockdowns generated a total profit that exceeded $200 million through July. This was due to favorable movements in ethanol, DDGS, and corn oil prices compared to corn prices. The profits of operating plants post-COVID were combined with the costs of shuttered ethanol plants in order to estimate the overall impact of the COVID pandemic on the industry. These estimated losses ranged from -$37 million to -$116 million. The estimates indicate that the COVID pandemic has imposed real losses on the U.S. ethanol industry, but these losses are at most in the hundreds of millions of dollars not billions of dollars. This should provide helpful perspective regarding the financial situation of the ethanol industry in the midst of the ongoing COVID pandemic.
Source : illinois.edu