By Gary Schnitkey and Nick Paulson et.al
Department of Agricultural and Consumer Economics
University of Illinois
By Carl Zulauf
Department of Agricultural, Environmental and Development Economics
Ohio State University
We developed a statistical model that projects the 2020 harvest price for soybeans, given a national soybean yield and average of May futures prices. This projection represents the harvest price used in crop insurance. The current U.S. yield estimate from the U.S. Department of Agriculture (USDA) is 49.8 bushels per acre. Given this yield estimate and average of actual May futures prices, the harvest price is projected to be $8.36 per bushel. An $8.36 harvest price would be 91% of the $9.17 projected price for soybeans in Midwest states. Crop insurance payments would not be triggered without yield declines even on Revenue Protection (RP) polices at an 85% coverage level. Lower yields, lower prices, or a combination of both would be needed to trigger payments. However, higher national yields would be expected to be associated with lower harvest prices, and vice versa.
Expected Harvest Prices for Different U.S. Yields
The statistical model used to predict harvest prices is based on two factors:
- Average of settlement prices of the November contract for soybeans on the Chicago Mercantile Exchange (CME) throughout the month of May. The harvest price is based on the average of settlement prices for the same November contract throughout the month of October. Using settlement prices in May provides unbiased estimates of harvest prices. Although the projected price for crop insurance is set using the average of February settlement prices for the same contract, the use of the May futures contract allows incorporation of a decrease in prices that have occurred after COVID-19 measures have been introduced.
- U.S. Soybean yield relative to trend yield. Soybean yields are estimates at this point in time, and weather in July and August will continue to have a large impact on actual yields. Historical relationships indicate that higher soybean yields will have a negative impact on prices. The U.S. soybean yield is regularly forecast in the World Agricultural Supply and Demand Estimate (WASDE) report produced by the Office of Chief Economist, U.S. Department of Agriculture. As WASDE reports are released, estimates of harvest prices can be revised.
Table 1 shows harvest price projections for different U.S. soybean yields. The June WASDE report has a yield estimate of 49.8 bushels per acre. At that yield, the expected harvest price is estimated at $8.36 per bushel (see Table 1). In this case, the harvest price is the expected average of settlement prices in the month of October for the November soybean contract traded on the CME. The harvest price is used to calculate crop insurance indemnity payments on soybeans in the Midwest states. An $8.36 harvest price would be 91% of the $9.17 projected price for 2020. Revenue Protection (RP) policies, even at the highest coverage level of 85%, would not trigger payments at an $8.36 price without yield declines below guarantee yields.
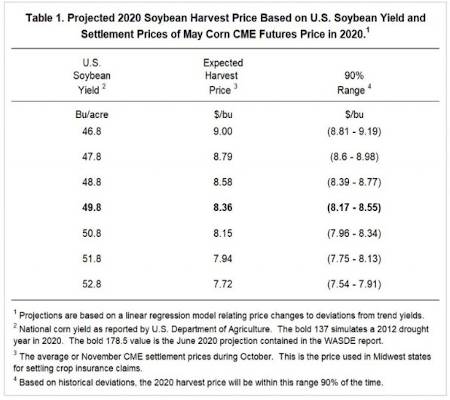
Actual harvest prices can vary from the expected $8.36 harvest price. The statistical model suggests that 90% of the time the harvest price will be in a range from $8.17 per bushel to $8.55 per bushel (see Table 1).
Higher yields will result in lower expected harvest prices. A 46.8 U.S. soybean yield has an expected harvest price of $9.00 per bushel, a 47.8 bushel yield would suggest an $8.79 harvest price, and so on (see Table 1). Table 1 shows a range of U.S. soybean yields from 46.8 to 52.8 bushels per acre. Given fairly normal weather, U.S. soybean yield likely will be in this range.
U.S. Soybean Yields and Trend Yields
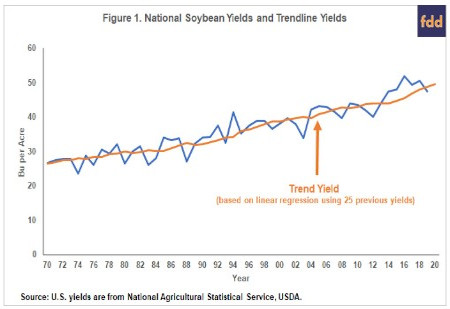
The statistical model was fit using yield data from 1985 to 2019. For each year from 1985 to 2019, a trend yield was calculated based on a linear regression of data from the previous 25 years. For example, the 2019 trend yield was estimated using yields from 1994 to 2018. In 2019, the trend yield was 48.7 bushels per acre. The actual 2019 yield was 47.4 bushels per acre, meaning that the actual yield was 1.3 bushels per acre below trend. Note that the trend yields used here will not fall on a straight line over time because the sample used to estimate the trend yield is changing (see Figure 1). Historically, more years are above the trend than below the trend (see Figure 1). From 1985 to 2019, actual yields were above trend in 66% of the years.
Deviations from May Settlement Prices and Harvest Prices
The average settlement prices of the November CME contract during the month of May were calculated for each year from 1985 to 2019. This May average will condition each year’s estimate of harvest price based on events that have occurred so far through the marketing year. The year 2020 has been a momentous year with the events surrounding the Coronavirus.
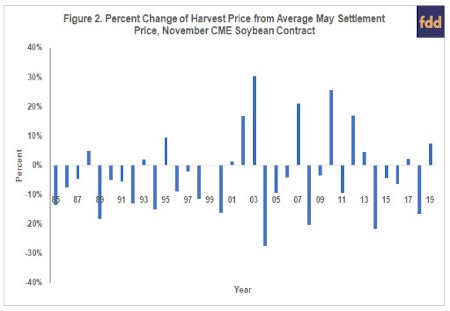
Percent changes were calculated between the actual harvest price and the average May settlement prices over the 35 year period. Take 2019 as an example when the May average was $8.62 per bushel, and the harvest price was $9.25 per bushel. The deviation during this year was 7% ($9.25 harvest price / $8.62 May average – 1). Figure 2 shows the percent deviations from 1985 to 2019.
Relationship Between Price Changes Given Actual Yield Differences Between Trend Yields
A linear relationship was fit in which the percent changes from the average settlement price in May to the average settlement price in October (harvest price) for the December corn contract were explained by the deviation from trend yield (actual yield minus trend yield). There is a strong relationship between price and yield deviations (see Figure 3). The price changes and yield deviations have a -.54 correlation coefficient. As is expected, price changes tend to be positive when actual yield is below the trend yield.

Summary
Given current yield estimates, a statistical model suggests that the harvest price for crop insurance in Midwest states will be near $8.36 per bushel. Higher yields, above current estimates, would be expected to result in lower prices and vice versa. Thus, higher prices could happen if 2020 yields are lower than the trend. Conversely, an above trend yield would likely result in lower prices. A harvest price below $8.00 per bushel is a distinct possibility with above trend yields.
Source : illinois.edu