Agriculture is a major user of ground and surface water in the United States, accounting for approximately 80 percent of the Nation's consumptive water use and over 90 percent in many Western States. Efficient irrigation systems and water management practices can help maintain farm profitability in an era of increasingly limited and more costly water supplies. Improved onfarm water management, combined with institutional measures improving watershed-scale water-management, including the use of conserved water rights, dry-year water banks, option water markets, and regulated irrigation withdrawals, may also reduce the impact of irrigated production on offsite water quality while conserving water for growing nonagricultural demands.
The effectiveness of agricultural conservation programs in supporting water conservation and environmental policy goals may vary with local hydrologic conditions; the type, size, and location of irrigated farms; and the legal and institutional measures governing water use. The ERS research, data, and information program investigates water allocation, conservation, and management issues associated with water scarcity challenges facing irrigated agriculture in a changing water environment. Topics examined include the following:
The ERS data product
Irrigated Agriculture in the United States summarizes the farm-structural characteristics for irrigated farms in each of the 50 States, the 17 Western States (aggregated) and the Nation as a whole, based on USDA's 2013 Farm and Ranch Irrigation Survey (FRIS). Data for the 17 Western States—based on USDA's 2008 and 1998 Farm and Ranch Irrigation Surveys—is available in a zipped archive file.
How Important is Irrigation to U.S. Agriculture?
Irrigated agriculture, which accounts for the largest share of the Nation's consumptive water use (see definitions), makes a significant contribution to the value of U.S. agricultural production. In 2012, irrigated farms accounted for roughly half of the total value of crop sales on 28 percent of U.S. harvested cropland. Irrigated farms also support the livestock and poultry sectors through irrigated production of animal forage and feed crops. Roughly 56 million acres—or 7.6 percent of all U.S. cropland and pastureland—were irrigated in 2012. Nearly three-quarters of irrigated acres are in the 17 western-most contiguous States (referred to as the Western States hereafter). From 2007 to 2012, irrigated acres declined by nearly 0.8 million acres across the United States. Most of the area decline occurred in the Western United States where drought conditions contributed to water-supply scarcity across the region. Contractions in State-level irrigated acreage exceeded 10 percent in Texas, Colorado, Oregon, New Mexico, and Oklahoma. In recent decades, much of the expansion in irrigated acreage has occurred in the more humid Eastern States. From 2007 to 2012 irrigated area in the East expanded by roughly 8 percent, with significant acreage increases in Arkansas, Louisiana, Mississippi, and Georgia. USDA's Farm and Ranch Irrigation Survey (FRIS) reports that in 2013, irrigated agriculture applied 88.5 million acre-feet of water nationally, with over four-fifths occurring in the West. (An acre-foot of water is equivalent to 325,851 gallons.) The U.S. Geological Survey (USGS), which monitors water use by economic sector, estimates that irrigated agriculture accounted for 38 percent of the Nation's freshwater withdrawals in 2010. Agriculture, however, accounts for approximately 80 to 90 percent of U.S. consumptive water use.
Where Does U.S. Crop Irrigation Occur?
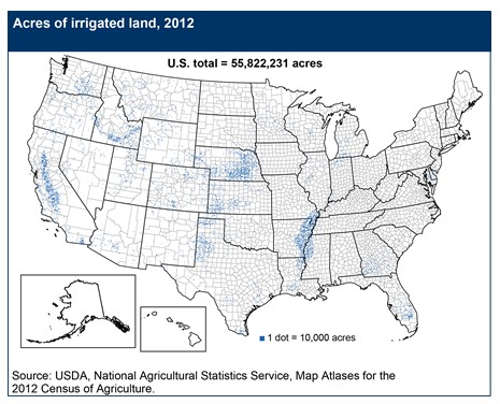
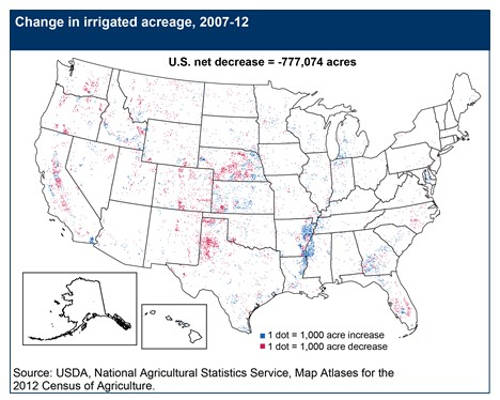
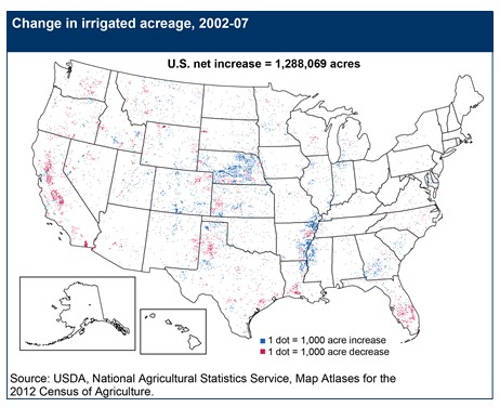
The most recent Census of Agriculture reported total U.S. irrigated cropland at 55.8 million acres for 2012, some 777,000 acres less than the peak of 56.6 million acres in 2007. From 2002-07, U.S. irrigated acreage had increased by nearly 1.3 million acres. Nebraska accounted for 72 percent of the increased acres, with most of the remainder occurring in the Mississippi Delta and Southeast regions (primarily Arkansas, Mississippi, and Georgia). California and Florida led the States where irrigated acres declined during this period (0.7 million acres in California and 0.3 million acres in Florida). From 2007 to 2012, the largest decreases in irrigated acres occurred in Texas (521,000 acres), Colorado (351,000 acres), Nebraska (262,000 acres), and Oregon (215,000 acres), with smaller declines in California and New Mexico. The larger net gains in irrigated acreage during this period occurred in Arkansas (343,000 acres) and Mississippi (283,000 acres), with smaller increases in Louisiana, Georgia, and Kansas. Since the 1997 Census of Agriculture, the dominant pattern of irrigated acreage change across the U.S. reflects a shift from the 17 Western States to the Delta and Southeast (with the exception of Florida).
USDA, National Agricultural Statistics Service (NASS) irrigation map atlases indicate that, for 2012, the vast majority of U.S. crop irrigation occurred across five primary regions: (1 and 2) the Columbia and Snake River Basins of the Pacific Northwest, (3) the California Central Valley, (4) the High Plains Ogallala region, and (5) the Mississippi Delta region. The maps also demonstrate that crop irrigation across the U.S. is not static, but rather dynamic. Irrigated area changes over time in response to local/regional water supply/demand and agronomic conditions, as well as economic and domestic/export crop-market considerations and long-term climate change.
Shares of total irrigated acres by State have also changed over time. The 13 leading irrigation States in 2012 accounted for 78.8 percent of all irrigated acres. Nebraska had the largest share of U.S. irrigated area with 8.3 million acres (14.9 percent), followed by California at 7.9 million acres (14.1 percent), Arkansas at 4.8 million acres (8.6 percent), and Texas at 4.5 million acres (8.0 percent). Other States accounting for an important share of irrigation include Idaho (6.0 percent), Kansas (5.2 percent), Colorado (4.5 percent), Montana (3.4 percent), Mississippi (3.0 percent), Washington (2.9 percent), Oregon (2.9 percent), Florida (2.7 percent), and Wyoming (2.6 percent). (In the prior 2007 Census of Agriculture, Texas had led Arkansas in irrigated acres.) While irrigated production is largely concentrated in the arid Western states, three Eastern States—Arkansas, Mississippi, and Florida—are among the 13 leading irrigation States.
Crops Produced With Irrigation
Irrigated agriculture accounts for a share of harvested acreage for most crops produced in the United States. Corn production accounted for roughly 25 percent of total U.S. irrigated acreage harvested in 2012, with much of that concentrated in the Northern and Southern Plains regions. Hay and other forage productions made up 18 percent of harvested irrigated acreage, with nearly 97 percent of that in the Western States. Nationally, other crops accounting for a significant share of total harvested irrigated acres include soybeans (14 percent), vegetables and orchard crops each (8 percent), cotton (7 percent), wheat (7 percent) and rice (5 percent).
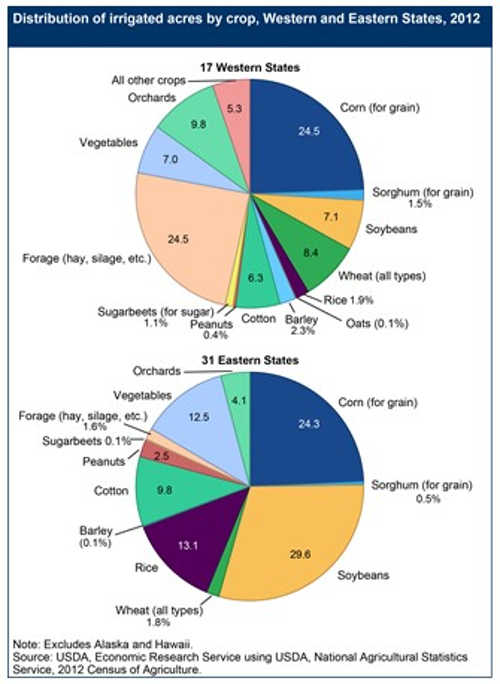
The figure illustrates the relative distribution of 2012 harvested irrigated acres, separately for the 17 western States and the 31 eastern States, by major crop category. Corn for grain and forage crops (hay, haylage, grass silage, and greenchop) account for the largest share (49 percent together) of all harvested irrigated crop acres in the West. Wheat, soybeans, orchards, and vegetables are the second largest group of irrigated crops in the West, with crop acreage shares ranging from 7.0 percent to 9.8 percent. In the Eastern States, corn for grain and soybeans account for the largest share (at a combined 54 percent) of harvested irrigated crop acres. Rice, cotton, and vegetables are the second largest group in the East (with crop shares ranging from 9.8 percent to 13.1 percent). Relative to the Western States, the irrigated cropping pattern in the Eastern States reflects a much smaller share of acreage in wheat and forage crops, and an increased share of irrigated acreage devoted to rice, soybeans, and vegetables.
Trends in Water Use and Onfarm Irrigation Efficiency
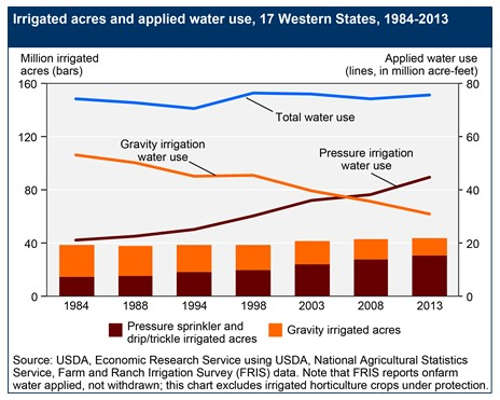
USDA NASS survey estimates reveal that total farm water applied has been relatively stable over time for the 17 western States, ranging from about 74 maf in 1984 to 76 maf in 2013. NASS estimates of irrigated acres in the West have also been relatively stable, ranging from about 39.1 to 39.6 million acres during the same time period. Of interest, however, is the shift in the way farmers have applied water to crop fields. In 1984, 62 percent of irrigated acres relied on gravity irrigation systems compared with only 34 percent of irrigated acres in 2013. Over the same period, the share of irrigated acres using pressure-sprinkler irrigation systems rose from 37 to 76 percent (note that some acres may be irrigated with both systems). The corresponding shift in applied water use by technology has been dramatic across the West. Water applied using gravity systems steadily declined from 71 percent to 41 percent of total water applied, while steadily increasing from 28 percent to 59 percent for pressure-sprinkler systems over this time period. For the Western States, the shift to greater dependence on pressure-sprinkler systems occurred in the late 1990s in terms of acreage. However, the shift in terms of onfarm applied water occurred sometime between 2003 and 2008, with pressure-sprinkler irrigation continuing to account for a growing share of applied irrigation water in the West. The timing of these shifts, however, varies significantly across and within the Western States. See the
2013 Farm and Ranch Irrigation Survey on the NASS website for more details.
Improvements in physical irrigation systems and water management have helped to increase on-farm irrigation efficiency—the share of applied water that is beneficially used by the crop. Water-use efficiency gains provide farm-level benefits, including improved crop yields and savings in water costs and other applied inputs. Improved water-use efficiencies can provide off-farm benefits as well, including improved fish and wildlife habitat, and reduced ecosystem and human health risks associated with environmental degradation. FRIS survey data reveal a shift to more efficient irrigation systems over recent decades, contributing to reduced average per-acre applied water rates across crops and regions. In 2013, water application rates in the Western States averaged 2.3 acre-feet per acre for gravity systems and 1.2 acre-feet for sprinkler systems. The efficiency of irrigation systems is particularly important in the arid Western States where water demand for agriculture is greatest, and where increases in competing demands and climate change impacts are expected to affect future water supplies for agriculture.
While substantial technological innovation has already occurred in U.S. irrigated agriculture, additional water-use efficiency gains are achievable. ERS estimated the share of Western irrigated acres using more efficient irrigation systems. More than half of irrigated cropland acres in the West continue to be irrigated with more traditional, less-efficient application systems. In addition, FRIS data indicate that the potential exists for increased irrigation efficiency through more extensive use of improved on-farm water-management practices. Fewer than 10 percent of irrigators make use of soil- or plant-moisture sensing devices or commercial irrigation scheduling services. Fewer than 2 percent make use of computer-based simulation models to determine irrigation requirements based on consumptive-use needs by crop-growth stage under local weather conditions.
Private and Public Investment in Irrigation Improvements
Irrigators continue to make significant capital investments in onfarm irrigation equipment and infrastructure. Approximately $2.64 billion was spent on irrigation facilities and equipment on U.S. farms in 2013. About 72 percent ($1.91 billion) of these investments were on land in the West, where most of the Nation’s irrigated land is concentrated.
The majority of U.S. irrigation investment is financed privately. About 90 percent of farms reporting irrigation improvements in 2013 received no public financial assistance (in the survey year). About 30 percent of the farms receiving public assistance for irrigation investments made use of USDA's Environmental Quality Incentives Program (EQIP), though these farms represented fewer than 5 percent of all irrigated farms that made irrigation investments in 2013. Nonetheless, EQIP funding has had an important cumulative impact on irrigation investments, contributing to farm profitability through improved yields and water and energy conservation as well as potential enhancements in local/regional water quality and environmental resources.
Nearly half (45 percent) of irrigation investments made in 2013 across the West were made for scheduled irrigation equipment or facility replacement and maintenance. Only 27 percent of total investments were made for new irrigation expansion, and only 24 percent were made to enhance onfarm water conservation. The remaining investments were made to reduce irrigation costs through energy conservation. Of the acres affected by irrigation investments made in 2013, nearly 85 percent involved privately funded investments. Only about 16 percent of irrigated acres affected by irrigation investments received publicly funded assistance through USDA’s EQIP, other USDA conservation programs, or through non-USDA assistance programs (including potential State-funded assistance programs). See the ERS data product,
Irrigated Agriculture in the United States for more details.
Definitions: Withdrawal, Applied, and Consumptive Water-Use Estimates
U.S. Geological Survey water use estimates generally refer to withdrawals, or the quantity of water withdrawn from a water source—e.g., a river, lake, or aquifer. USDA Farm & Ranch Irrigation Survey (FRIS) reports onfarm applied water use, referring to producer estimates of the quantity of water applied to the field (for a particular crop) via an onfarm irrigation application system—e.g., a gravity-flow system or a low-pressure center-pivot sprinkler system. Annual crop consumptive-use estimates refer to the quantity of water actually consumed (taken up) by the crop plant over its various crop-growth stages for crop retention and evapotranspiration. Withdrawal estimates generally reflect diversion system conveyance losses, while estimates of field water applied do not. Consumptive-use estimates may or may not account for associated system efficiency losses (e.g., evaporation, deep percolation, and runoff) and salt-leaching requirements for a given crop, location, and irrigation system. Which estimate to use and how to use it are important in clarifying discussions of water use and policy.