By Gary Schnitkey, Krista Swanson et.al
Department of Agricultural and Consumer Economics
University of Illinois
By Carl Zulauf
Department of Agricultural, Environmental and Development Economics
Ohio State University
Reductions in the sales value of unpriced grain likely will be the first place where grain farms feel the impacts of COVID-19 control measures. Overall, old-crop sales likely will be reduced from expectations prior to COVID-19 concerns. Some farms will be more impacted by these concerns than other farms. Before discussing old-crop cash flows, a general discussion of all cash flows impacted by COVID-19 is given.
Cash Flows impacted by COVID-19
Potential cash flows of grain farm receipts are depicted on the timeline shown in Figure 1. All of these cash flows may be affected by COVID-19 concerns and the impact of control measures. These cash flows include:
- Old-2019 crop sales. Old crop sales are sales of crops produced in 2019 that are sold in 2020.
- New-2020 crop sales. New crop sales are sales of crops produced in 2020. Regardless of when sales are contracted, cash flows for the sales usually begin in September and continue into 2021 as additional sales are made.
- 2019 Agricultural Risk Coverage (ARC) and Price Loss Coverage (PLC) payments. These will be received in October. As covered in last week’s farmdoc daily, these ARC/PLC payments could increase from previous expectations due to a decline in 2019 market year average (MYA) prices.
- Crop insurance payments for the 2020 crop. For COMBO products, crop insurance payments, if triggered, would occur in November and December. Area products would make 2020 payments in June 2021.
- Sales of future crops could also be impacted by COVID-19. The extent of COVID-19 impact is unknown but could be prolonged and extend into future crop years.
- 2020 ARC/PLC payments, if triggered, will be received in October 2021. Similar to 2019 crop year payments, reductions in 2020 market year average price forecasts increase expectations for 2020 ARC/PLC payments.
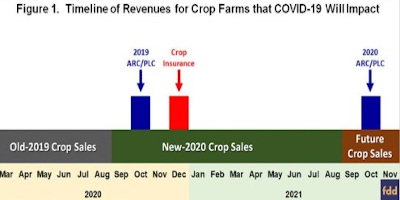
Note that the timeline in Figure 1 does not include Federal aid from programs like the Market Facilitation Program (MFP) received in 2018, 2019, and early 2020. Additional Federal aid to farmers has not been announced. In any case, that cash flow might not occur until fall, particularly if the previous two years serve as a guide for 2020. Also, support to farmers could come from the recently passed Coronavirus Aid, Relief, and Economics Security (CARES) Act, but few details on these programs exist as of yet.
Most likely, Federal aid, if any, will not occur until after August. As such, the only major cash flow receipts coming to farms will be from old-2019 crop sales from now till August. There may be other cash flows into operations from other farm and off-farm enterprises (e.g., custom work, livestock enterprises, input supply business) and off-farm employment. But those cash flows are not strictly from grain operations.
Old-2019 Crop Sales
The impact of COVID-19 on cash flows from old-2019 crop will vary across each farm, depending on the amount of unpriced grain. The following provides an example representative of a typical farm in central Illinois.
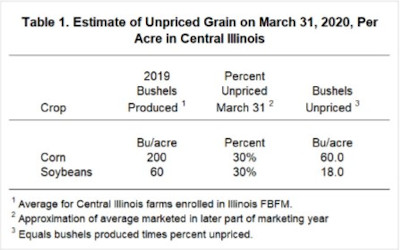
In 2019, yields across central Illinois averaged about 200 bushels per acre for corn and 60 bushels per acre for soybeans. On many farms, 30% of these bushels likely are not priced as of the end of March (see farmdoc daily, March 24, 2020 for a discussion). A percentage of 30% unpriced grain would result in 60 bushels per acre of corn and 18 bushels per acre of soybeans left to be priced (see Table 1).
Throughout January and February, corn prices in central Illinois averaged close to $3.80 per bushel for corn and $8.90 per bushel for soybeans (see farmdoc daily, March 24, 2020 for a discussion of this year’s prices). Given the unpriced bushels shown in Table 1, the value of crops unpriced before COVID-19 would have been $228 per acre for corn (60 bushels per acre x $3.80 price) and $160 per bushel for soybeans (18 bushels per acre x $8.90 price). Assuming a 50% corn and 50% soybean rotation, the per acre average value of unpriced gain would have been $194 per acre (see Table 2 for calculations).
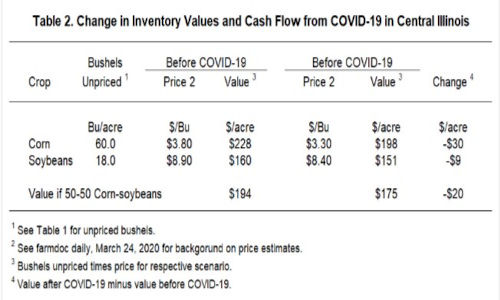
Current cash prices in central Illinois are near $3.30 per bushel for corn and $8.40 per bushel for soybeans. These prices result in lower values for unpriced grain. Corn value decreased by $30 per acre from $228 before COVID-19 to $198 per acre after COVID-19 (see Table 2). Soybean value decreased by $9 per acre from $160 per acre down to $151 per acre. Given a 50-50 rotation, value of unpriced grain decreased by $20 per acre.
Cash Flow Responses to $20 Decline in Old-2019 Cash Flow
A $20 per acre decline in old crop sales would result in a $30,000 decrease in cash flows on a 1,500 acre farm from April to September, the typical period in which the remaining portion of old crop is marketed. How a farm handles this situation will depend on a farm’s existing levels of working capital. The usual progression of responses would be:
- First, a reduction in projected old-crop cash sales may lead to a reduction in a farmer’s other current assets such as cash and marketable securities. Many farms likely have significant enough cash reserves that a $20 per acre decline can be handled in this manner.
- If cash reserves do not exist, additional borrowings would be needed, most likely from an operating line of credit. Many farms will have sufficiently large operating lines of credits to cover a $20 per acre cash shortfall.
Other farmers may have insufficient working capital to cover this shortfall. In this case, responses include:
- Consult with lenders to see if lines of credit can be increased, or if other financing alternatives exist.
- Shift acreage from corn to soybeans for 2020 planting. Soybean acres generally have lower costs than corn. Thus, shifting acreage may reduce cash flow demands.
- Cutting costs in other areas, if possible, may help to reduce cash flow demands.
Commentary
Re-evaluating cash flows for the coming months may be a valuable activity, particularly for those operations with low working capital at the beginning of the year. FAST Microsoft Excel spreadsheets may be useful. The Cash Flow Planning tool will calculate a 12-month cash flow. The Quick Cash Flow program is also a useful tool for cash flow planning.
Source : illinois.edu