By Gary Schnitkey and Krista Swanson et.al
Department of Agricultural and Consumer Economics
University of Illinois
By Carl Zulauf
Department of Agricultural, Environmental and Development Economics
Ohio State University
By Bradley Zwilling
Illinois FBFM Association and Department of Agricultural and Consumer Economics
University of Illinois
In 2019, many farmers in Illinois had prevented plant (PP) acres, acres that couldn’t be planted due to excessive moisture throughout the planting season. Previous analyses indicated that taking PP was an economically better alternative than planting (farmdoc daily, December 30, 2019 and June 4, 2019). Even given its economic advisability, taking PP did not lead to farms having higher incomes than those who generally had less PP. Farms that had a larger proportion of their acres in PP experienced larger declines in income from 2018 to 2019.
Farms Included in Study
Table 1 shows 2018 and 2019 incomes on Illinois grain farms enrolled in Illinois Farm Business Farm Management (FBFM). To be included in Table 1, a farm had to meet the following criteria:
- Received the majority of their income from grain operations,
- Had over 500 acres, and
- Had records that were certified useable by Illinois FBFM staff in both 2018 and 2019.
A total of 1,483 farms met these criteria, with results for all farms given in Panel A.
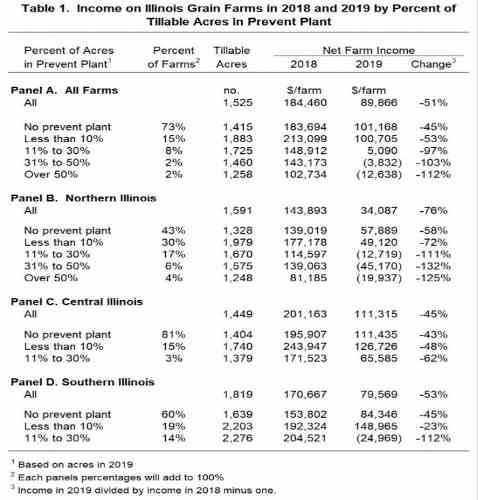
For all farms, tillable acres averaged 1,525 per acre, with a range of 500 acres to over 13,000 acres. Net farm income averaged $184,460 in 2018, declining by 51% to $89,866 in 2019 (see Panel A of Table 1)
Income Declines as Percent Prevented Plant Acres Increases
In Panel A, the 1,483 farms are divided into five categories based on the proportion of PP acres. In 2019, 73% of the farms had no PP acres. Despite the wet spring in 2019, most Illinois grain farms planted all acres in 2019. Still, of the farms in this sample, a sizable proportion (27%) had some PP. Of those farms that had PP, 15% had less than 10% of their acres in PP. Percentage of farms declines as the proportion of PP acres increased: 8% had between 11% and 30% of acres in PP, 2% had between 31% to 50%, and 2% had over 50%.
Income declines became larger as the proportion of acres of PP increased, as shown in the last column in Panel A of Table 1. With no PP, the average income change was -45% from 2018 to 2019. The income change was
- -53% when PP when less than 10%,
- -97% when 11% to 30% of acres were PP,
- -103% when 31% to 50% of acres were PP, and
- -112% when over 50% of acres were PP.
On average, net incomes in 2019 were negative when over 31% of acres where PP: -$3,832 per farm when PP was between 31% to 50%, and -$12,638 when PP was over 50% of tillable acres.
Incomes in Table 1 include all sources of revenue, including from government payments offered in 2019, such as the Market Facilitation Program (MFP) which was intended to counter lost income as a result of trade conflicts (farmdoc daily, July 30, 2019). Also included is the 10% increase in PP indemnity payments as part of the WHIP+ disaster aid program.
Income Declines by Region in Illinois
Northern Illinois had more PP than other areas of Illinois. Only 43% of the farms located in northern Illinois got all their acres planted, compared to 81% for central Illinois and 60% for southern Illinois. Over 10% of northern Illinois farms had over 30% of their acreage in PP (6% in 31% too 50% and 4% in over 50% categories). Income declines were larger in northern Illinois than in other parts of Illinois. The average income change in northern Illinois was -76%, compared to -45% for central Illinois and -53% for southern Illinois.
Commentary
It is highly likely that PP was the best economic alternative on the majority of farms taking PP given the late planting that occurred (farmdoc daily, December 30, 2019 and June 4, 2019). Taking prevent plant provided large crop insurance payments to farms on those acres, as opposed to planting late in poor conditions and past the optimal time. However, these payments did not result in overall farm incomes that were larger than for farms who were able to plant in better conditions.
There has been some thought that PP payments may provide more than adequate compensation (see Brasher). In 2019, for example, the Risk Management Agency lowered the standard PP payment factor on corn from 60% of the guarantee to 55% (see Risk Management Agency). As incomes declined with more PP, income results in this article do not support the contention that PP provides overcompensation. Of course, results could vary across years and regions.
The above results do not present an analysis of whether taking PP or planting was the correct decision. To conduct that PP/plant comparison using farm-level data, one would have to link up farms with the same growing conditions who made different PP/plant decisions and then see corresponding results. Farms with large amounts of PP likely also planted into less than ideal conditions, which could also have resulted in lower incomes. In this article, we compare incomes with different levels of PP. Given the reluctance of Illinois farmers to take PP, we assume that most farmers who took PP had no alternative but to take PP.
Source : illinois.edu