By Carl Zulauf and Allan Lines
Department of Agricultural, Environmental and Development Economics
Ohio State University
Corn and soybeans are the largest acreage field crops in the US. They are also competitors and complements in supply and demand. The soybean-corn price ratio thus garners substantial attention. Long-term trend in this price ratio is examined, reaching the same conclusion as a September 6, 2013 farmdoc daily article: the soybean-corn price ratio exhibits no trend over time despite changes in production and consumption of both crops. Two of the changes in production are also examined via ratios: the soybean-corn acreage ratio is increasing but the soybean-corn yield ratio is decreasing.
Data and Procedures
The data in this article are from
Quick Stats, a data file maintained by the US Department of Agriculture, National Agricultural Statistical Service. The analysis starts with the 1974 crop year. In the early 1970s, price volatility increased notably as the market replaced US farm policy as the more important determinant of price.
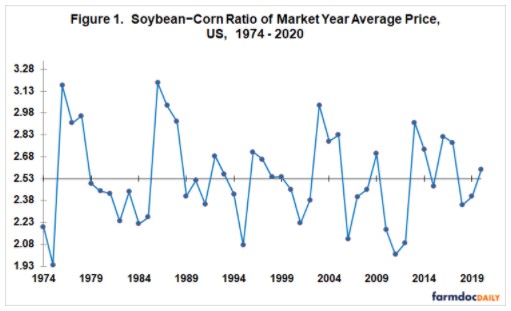
US Soybean−Corn Price Ratio
Since 1974, the ratio of soybean to corn market year price has averaged 2.53 (see Figure 1). The soybean market year price has thus averaged 2.53 times higher than the corn market year price. No time trend is evident, with a linear time trend explaining only 0.19% of the annual variation in the price ratio. Lowest ratio is 1.94 for the 1975 crop year; highest ratio is 3.19 for the 1986 crop year. Next lowest (highest) ratio is 2.01 for 2011 (3.17 for 1976). The ratio also exceeded 3.0 in 1987 and 2003 (both 3.03). Figure 1 suggests the variability of the ratio may be declining over time, particularly on the high side. This may reflect the emergence of South American as a major soybean producer. Price ratio for the current 2020 market year is 2.59, or slightly above the long-term average.
US Soybean−Corn Acre Ratio
Soybean acres have increased vs. corn acres, resulting in a higher soybean−corn acre ratio over time (see Figure 2). The trend is significant with 99% statistical confidence. However, it explains only 26% of the annual variation in the acre ratio. Other factors thus determine approximately three quarters of the annual variation. The time trend equation finds soybean acres have gained on corn acres by 0.35 percentage points (PP) per year. This value may seem small, but it adds up. Average acres planted to soybeans were 50% higher in 2016-2020 than 1974-1978. Corn acres were up only 11%. US soybean acres clearly exceeded US corn acres only once, in 1983. A government program, known as Payment-in-Kind (PIK), paid farmers to not plant a large number of corn acres. Planted acres were nearly the same in 2017 and 2018.
US Soybean – Corn Yield Ratio
Soybean yields have increased slower than corn yields, resulting is a lower soybean−corn yield ratio over time (see Figure 3). A linear time trend is significant with 99% statistical confidence. It explains 18% of the annual variation of the yield ratio, which is less than for the acre ratio. The time trend equation implies soybean yields have increased .06 percentage points less per year than have corn yields. Again, this small difference adds up. Corn yield per harvested acre was 97% higher in 2016-2020 than 1974-1978. Soybean harvest yield was 78% higher.
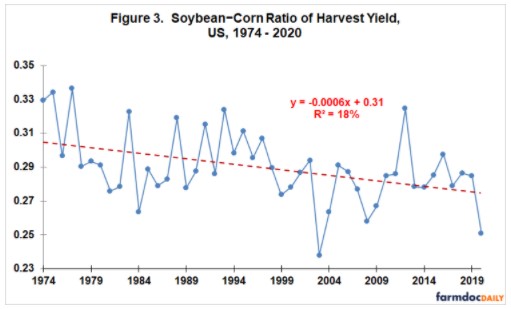
Figure 3 helps us understand how much corn and soybean yields can diverge from their usual relationship in a given year. For the upcoming 2021 crop year, the time trend equation forecasts a 0.274 soybean−corn yield ratio. A 185 bushel corn harvest yield is thus associated with a 50.8 (185 times 0.274) bushel soybean harvest yield. Standard error of the time-trend equation is 0.019, which implies the soybean−corn yield ratio for 2021 has a 67% chance of being between 0.255 (0.274 – 0.019) and 0.294 (0.274 + 0.019). These 2 yield ratios imply that, given a 185 bushel corn yield, the US average soybean yield has a 67% chance of being between 47.2 (0.255 times 185) and 54.3 (0.294 times 185). This wide range underscores how much average US corn and soybean yield can diverge from their usual relationship in a given year.
Summary Observations
A key price ratio for the US crop sector is the soybean−corn price ratio. Despite notable changes in supply and demand for the 2 largest acreage US field crops since 1974, the ratio has exhibited no discernible time trend. It does however exhibit considerable variation from year to year.
Unsurprisingly, due to the growth in soybean acres the ratio of soybean to corn acres has trended up over time. In contrast, the ratio of soybean to corn yield has trended down as yield has increased slightly faster for corn. The slightly faster growth in corn yields mean that slightly fewer acres need to move into corn than into soybeans if demand for corn and soybeans grows at the same percent rate.
The soybean-corn yield ratio can vary substantially from its usual relationship. This variability is a risk associated with selecting which crop to plant. It may have greater importance in 2021 as lower stocks mean higher price variability, making income foregone from choosing the crop that’s ends up with the lower income potentially larger in 2021. Enhanced risk may affect cropping decisions, cropping practices, crop insurance decisions, and forward pricing decisions.
Source : illinois.edu