By Alan Sundermeier
ABSTRACT
Soil health is defined as the continued capacity of soil to function as a vital living ecosystem that sustains plants, animals, and humans. Soil health indicators are measurements of the physical, chemical, and biological properties of the soil. As more tools become available to measure soil health factors, it is critical that we evaluate the efficacy of these tools. This 2-year project in Northwest Ohio measured the impact that soil conservation practices have on selected soil health indicators and the subsequent corn yield in cover cropped hay, wheat and corn cropping systems. Soil respiration was measured by the Solvita™ field test and the laboratory burst test for carbon dioxide release. Soil nitrogen as nitrate and ammonium were measured. Carbon dioxide emissions were greatest on the fescue sod field border (148 pounds per acre carbon dioxide), yet had the lowest soil nitrate (1 ppm).
INTRODUCTION
Soil health is defined as the continued capacity of soil to function as a vital living ecosystem that sustains plants, animals, and humans (USDA NRCS). Soil health indicators are measurements of the physical, chemical, and biological properties of the soil. Soil health measurements can be used to better understand the capability of soil to provide essential nutrients for growing crops. As the soil is managed with conservation practices, such as cover crops or reduced tillage, the soil health changes that these practices create in the soil can be measured and compared (Clark, 2007). The results may then be used to assist with making soil management decisions. Crop yield is the final comparison which measures the impact of soil management on crop productivity. The benefits of
cover crop mixtures can result in improved cover crop growth and subsequent grain yields. Multi-year soil health improvement measurements that quantify long-term benefits of soil conservation practices are needed. Soil respiration is the primary measure of carbon dioxide released by microorganisms in the soil (Solvita, n.d.). As the activity and number of soil microbes increase, carbon dioxide release from the soil increases (Sciarappa et al., 2015). The increased biological activity of these soil microbes is an indicator of a healthy soil (Sciarappa et al, 2015). Soil conservation practices such as cover crops and reduced tillage can favorably improve soil health by increasing the number of soil organisms that break down organic matter, and in the process, release plant nutrients. Solvita™ is a biological respiration test using a patented gel-technology system to measure carbon dioxide (Ward laboratories, Inc., n.d.). Results of Solvita™ measurements are a general indicator of soil health given in carbon dioxide emissions per surface acre basis. In addition to measuring microbial activity with respiration, nutrient availability should also be measured for an understanding of crop growth and yield. The Solvita™ test needs to be used in conjunction with soil nitrate and ammonium tests to determine soil health and productivity. This study focuses on soil respiration, nitrate, ammonium, and crop yield as soil health indicators. The goal of this project is to compare predicted soil health ratings with measured crop yield. Many more measurements are becoming available to test soil health as standards are being determined. Other potential soil health indicators include infiltration, bulk density, active carbon, microbial biomass, and aggregate stability.
METHODS
This two year project occurred in 2014 and 2015 at the Ohio Agriculture Research and Development Center Northwest Agriculture Research Station located near Custar, Ohio. The field was planted to soybeans in 2013. Treatments are shown in Table 1, and consisted of cover crops no-till planted in 2014 (Treatments #1, 3, and 6), conservation tillage (Treatment #2), and no tillage/no cover (Treatment #5). Samples were also collected from the sod bordering the field (Treatment #4). All treatments except for the sod border were replicated four times in a randomized complete block design. Plot size was 10 x 80 feet. Herbicides were applied on April 17, 2015 to kill existing cover crop growth. Pioneer 0496AMX corn was seeded on all treatment plots except sod border on May 8, 2015 by a no-till seeder, with all plots receiving the same tillage, fertilizer and corn seeding rate (32,000 seeds/acre). Side-dressed nitrogen (28% UAN) was applied at a rate of 66 gallons per acre on June 23 during the V6 corn stage. Corn was harvested on October 16. Harvest data was collected from the center two rows in each plot.
Table 1. Conservation practices applied to field trial in 2014.
Treatment #1 (Multi) consisted of a mix of the following cover crop species: winter pea, cow pea, sun hemp, oats, pearl millet, radish, ethiopian cabbage, and sunflower. Red clover (Treatment #6) was broadcast-seeded into growing wheat on April 24, 2014. Red clover continued to grow after wheat harvest in July and was terminated by herbicide application the following spring when corn was planted. The Multi (treatment #1) and Winter Pea (treatment #3) cover crops were drill planted with no tillage into wheat residue on August 13 (Sundermeier, 2015). Soil respiration samples for the Solvita™ tests were collected by using a core sampler to minimize the disturbance of the soil core. Soil respiration samples were single measurements, collected from one replicate plot per treatment, taken on May 8, May 20, and June 8, 2015.
Figure 1. Collecting core samples for soil respiration test.
The soil respiration Solvita™ test was conducted by two different methods, the Solvita™ field test and the laboratory burst test. The field test can be done on site with fresh, moist, and undisturbed soil. The collected soil is directly transferred from the field to the sample jar and incubated 24 hours at room temperature. A paddle with the gel-technology system reacts with carbon dioxide released from the soil in the jar and changes color. Paddle color change correlates with respiration activity and can be visually measured or precisely recorded with a digital color reader (Figures 2 and 3). To convert the field test color index reading into CO2 respiration values, the Basic Solvita™ Field Test CO2 Calculator was used (https://solvita.com/soil/basal-co2-guide/). Values are adjusted to soil temperature at the time of sampling. Respiration rates are reported in pounds per acre CO2 (Ward Laboratories, Inc, n.d.).
Figure 2. Jars and Gel Paddles for Solvita test.
Figure 3. Digital Color Reader.
The Solvita™ carbon dioxide burst test was conducted at a certified laboratory (Ward Laboratory, Nebraska). Carbon dioxide burst tests were single measurements, collected from one replicate plot per treatment, on June 18. When shipping samples, care was taken to avoid excess heating or collapse of the soil sample in order to prevent the sample from respiring during shipment. Therefore, soil samples were shipped with a container of dry ice and cushioned in the shipping box. Once received at the laboratory, samples were dried and remoistened with a specific amount of water, which causes a “burst” release of carbon dioxide. Measurements were taken with the same method as the field test. Soil nitrate and ammonium samples were collected from 0-12 inch deep soil probes and sent to A & L labs in Fort Wayne, Indiana. Samples were collected at the same location and dates as the field respiration tests: single measurements, collected from one replicate plot per treatment, taken on May 8, May 20, and June 8, 2015. Ammonium analysis was conducted from the same samples submitted for nitrate analysis. Measurement of profitability as corn grain yield was analyzed from randomized, replicated treatments.
RESULTS
The field test for carbon dioxide showed variability among treatments both within the same sample date and variability between different sample dates (Figure 4). Sod treatment had 148 pounds per acre CO2 measured on May 6 with the field test. This compared to 14 pounds per acre CO2 for the no cover treatment on the same date. The May 18 sample date had red clover with the highest CO2 measurement at 148 pounds per acre CO2. However, multi-species cover crop (23 pounds per acre CO2) had the lowest measurement on that date. The June 3 sample date had lower values measured in the cover crop and sod treatments compared to the May sample dates.
Figure 4. Carbon dioxide measurements from Solvita field tests on three dates, expressed as lbs CO2/acre.
The burst test on June 18 (Figure 5) showed similar CO2 values for cover crop treatments, with multi-species (131 lbs/acre), winter pea (120 lbs/acre), and red clover (125 lbs/acre). The highest value (143 lbs/acre) was measured in the tillage treatment.
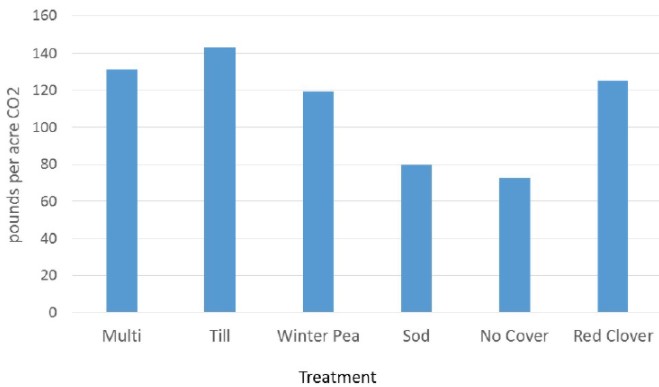
Figure 5. Carbon dioxide measurements from Solvita burst tests from June 18, expressed as lbs CO2/acre. Comparison between the field and burst test showed much higher values for the burst test. The field test on June 3 had the same value (73 lbs CO2/acre ) for multi-species, winter pea, and red clover treatments. This was 47 – 58 pounds per acre less than the burst test for the same treatments. The June 8 sample date (Table 2) showed the highest nitrogen measurements (both nitrate and ammonium) among all treatments except sod. On June 8, red clover measured 18 ppm nitrate compared to 1 ppm for sod. Across all sample dates and treatments, red clover measured consistently high nitrate and ammonium levels. Tillage treatment was comparable to multi-species and winter pea for nitrate and ammonium on the June 8 sample date.
Click here to see more...