Among farmers and ranchers, very few topics are being discussed as much as the skyrocketing cost of fertilizer and increasing concerns regarding availability. Given that fertilizer costs account for approximately 15% of total cash costs in the U.S., fertilizer prices are the number one issue on farmers’ minds as they begin to set up purchases for the 2022 growing season. Unfortunately, the fertilizer sticker price farmers in some areas are reporting is up more than 300% and delivery times are anyone’s best guess. We’ve seen this before, in 2008. During the 12 months ending in April 2008, nitrogen prices increased 32%, phosphate prices increased 93% and potash prices increased 100%. Prices remained there through 2009, then dropped, ultimately returning to pre-2007 levels by the end of 2009. That price surge was associated with strong domestic and global demand, low fertilizer inventories and the inability of the U.S. fertilizer industry to adjust production levels. This time around, those same factors are at play, along with several others that add an extra layer of uncertainty.
This article dives into a number of the short- and long-run factors impacting fertilizer supply and demand to provide context to the increasingly expensive production input.
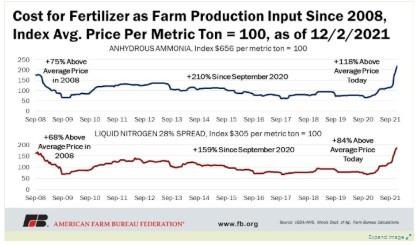
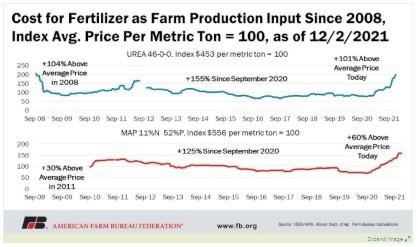
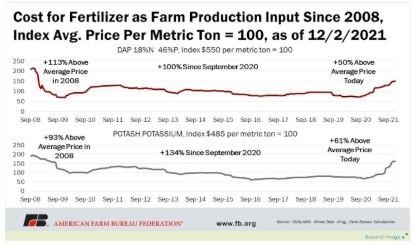
All major nutrients used in the production of primary row crops in the U.S., nitrogen (in the forms of anhydrous ammonia, urea, or liquid nitrogen), phosphorus (diammonium phosphate – DAP and monoammonium phosphate – MAP) and potassium (potash), have experienced varying degrees of upward price pressure. Compared to September 2020 prices, ammonia has increased over 210%, liquid nitrogen has increased over 159%, urea is up 155%, and MAP has increased 125%, while DAP is up over 100% and potash has risen above 134%.
Looking at the average price of each nutrient since September 2008, as collected in the Illinois cost of production dataset, anhydrous ammonia is up 118% above its average of $656 per metric ton; urea is up 101% from its $453 per metric ton average; liquid nitrogen is up 84% from its $305 per metric ton average; DAP is up 50% from its $550 per metric ton average; MAP is up 61% from its $555 per metric ton average; and potash is up 61% from its $485 per metric ton average.
Fertilizer is a global commodity and can be influenced by multiple market factors beyond the control of U.S. producers. Similar to globally traded commodities, 44% of all fertilizer materials are exported to a different country. This factor has an outsized impact on fertilizer prices because fertilizer production is not only influenced by what is occurring where it is produced or the cost of production in that country, but also affected by the numerous other countries demanding fertilizer products and the transportation rates to get the fertilizer to its final destination.
Increased Global Fertilizer Demand
Two-thirds of global fertilizer demand is driven primarily by six crops. Globally, corn represents about 16% of the farm-use fertilizer demand, with wheat a close second, representing about 15% of global farm-use fertilizer demand. Rice represents about 14% of global farm-use fertilizer demand, followed by vegetables at 9%, fruits at 7% and soybeans at 5%.
As a large producer of corn, soybeans and wheat, the U.S. is a large consumer of fertilizer. However, with increased technology and innovation for on-farm products, the use of fertilizer in the U.S. has decreased, despite increased planted acres of these crops. At peak use, during the 1980/81 fiscal year, the U.S. used 23.7 million nutrient tons but has pulled back due to the adoption of precision fertilizer application, as shown by the most recent data available – 2015/16 – when U.S. nutrient use was reported at 22.1 million nutrient tons. Corn represents about 49% of the share of U.S. nutrient use, while wheat accounts for about 11% and soybeans account for 10%. Cumulatively, those three crops account for about 70% of U.S. fertilizer consumption.
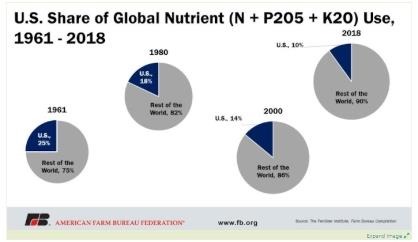
Though the U.S. has lowered its overall consumption of global nutrient use, other countries have increased nutrient use. Back in the 1960s, the U.S. accounted for 25% of global nutrient use. Today, the U.S. only accounts for about 10% of global use, with U.S. farmers representing only 2% of that share.
The Multitude of Supply Factors
Domestic Production vs. Imports
The U.S. is the third-largest producer of fertilizer globally, however, it still requires the importation of all three nutrients, especially nitrogen and potash, to fully meet demand. This means that U.S. fertilizer dealers and U.S. producers are required to pay the price defined by the global market for fertilizer and fertilizer materials, plus transportation.
In 2020, U.S. ammonia was produced at 36 domestic plants and shipped around the country by pipeline, rail, barge and truck. According to the most recent data from the International Fertilizer Association, in 2018 the U.S. ranked second in nitrogen production, representing 11.6% of global production, behind China, which produced 24.6% of nitrogen, and ahead of India, which is the third-largest global producer of nitrogen, producing 11.3% of global supply. For phosphate production, the U.S. also ranked second, with 9.9% of global production, behind China, which produced 37.7%, and again ahead of India, with 9.8% of the global supply of phosphate. For potassium potash, Canada leads the way in production, representing 31.9% of global production, followed by Belarus, which produces 16.5% of global supply. Russia is a close third as it produces 16.1% of potassium global supply. China ranks fourth. In total, about 80% of the world’s potash comes from those four countries. The U.S. ranks as low as 11th in potassium production, with only 0.8% of global supply coming from the U.S.
When it comes to global exports, the U.S. is not a major fertilizer exporter. The U.S. holds a share of about 4.6% of the nitrogen exports, ranking seventh. Russia is first, with a share of 16.5% of exported nitrogen, followed by China with about 11.2% of share in nitrogen exports, and Saudi Arabia, which holds a share of 6.4% of nitrogen exports.
Of phosphate exports, the fourth-ranked U.S. represents about 11.8%. China is first in phosphate exports, holding a share of 25.2% of global phosphate exports, followed by Morocco with a share of 17.4%, and Russia with a share of 12.7% of global phosphate exports. Of the global potassium exports, the U.S. represents less than 1% of global exports and ranks 12th among other countries. Canada holds the largest share of global potassium exports with 36.2%, followed by Belarus with an export share of 18.5% and Russia, which represents 16.5% of global potassium exports.
Click here to see more...