By Scott Irwin
There is no shortage of information on the problem of global warming due to increased CO2 emissions into the atmosphere. A good overview can be found at the NASA website here. It may seem obvious, but it is worth re-stating that climate change is a global phenomenon typically measured in terms of global averages. Less attention has been paid to changes in the climate for smaller geographic areas, like the U.S. Corn Belt. While the Corn Belt looms large in global grain production, it represents only 0.3 percent of the total surface area of the world. Even if one restricts attention to land area, the Corn Belt only represents 0.4 percent of total land mass around the world. Given that the Corn Belt is such a tiny sliver of global surface area, climatic trends could certainly vary substantially from broad global averages. The purpose of this article is to examine trends in monthly temperature and precipitation during the growing season for the U.S. Corn Belt. Two sample periods will be considered in the analysis. The first is 1980 through 2023, the same as that used in the estimation of a crop weather model of the U.S. average corn yield in several recent farmdoc daily articles (October 9, 2023; April 8, 2024; April 29, 2024; May 6, 2024). The second is 1895 through 2023, which is the longest series of monthly observations available from the U.S. National Weather Service.
Analysis
The monthly weather data are collected for 10 key corn-producing states (Iowa, Illinois, Indiana, Minnesota, Missouri, Nebraska, North Dakota, Ohio, South Dakota, and Wisconsin) over 1895 through 2023. These 10 states typically accounted for about 75 to 80 percent of total U.S harvested acreage of corn over 1980 through 2023. The percentage of total U.S. acreage is lower in years before 1980, reaching as low as 50 percent in the early years of the 20th century. Aggregate weather observations for the 10-states are constructed using harvested corn acres to weight state-specific observations relative to the total harvested acreage for the 10-states. While the acreage-weighted weather variables represent a lower percentage of total U.S. acreage as one moves back in time, the variables have the beneficial characteristic of representing the same geographic area through time. In addition, the percentage of harvested acreage for each state relative to the 10-state total changes only moderately through time.
The National Weather Service is the source for the weather data via the Midwest Regional Climate Center. It is important to recognize that the temperature data are monthly averages, and the precipitation data are monthly totals. Different results may be generated by more granular weather observations through time and space. For example, daytime and overnight temperature trends may differ. The key advantage of the weighted-average monthly weather variables examined here is that they are known to represent the most important variables driving the variation in the U.S. average corn yield from year-to-year (e.g., farmdoc daily, October 9, 2023). The specific variables examined are: 1) April, May, June, July, and August temperature; and 2) preseason (September-March), April, May, June, July, and August precipitation. September temperature and May precipitation are not included in the crop weather model used in previous farmdoc daily articles but are examined here for completeness. The two non-weather variables in the model, a technology trend and late planting, are excluded from the analysis.
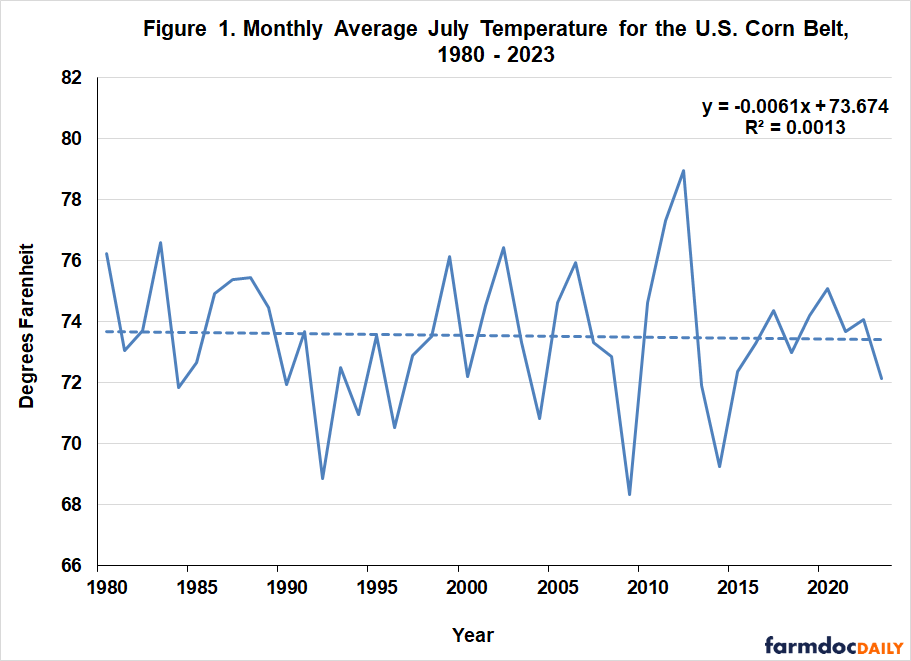
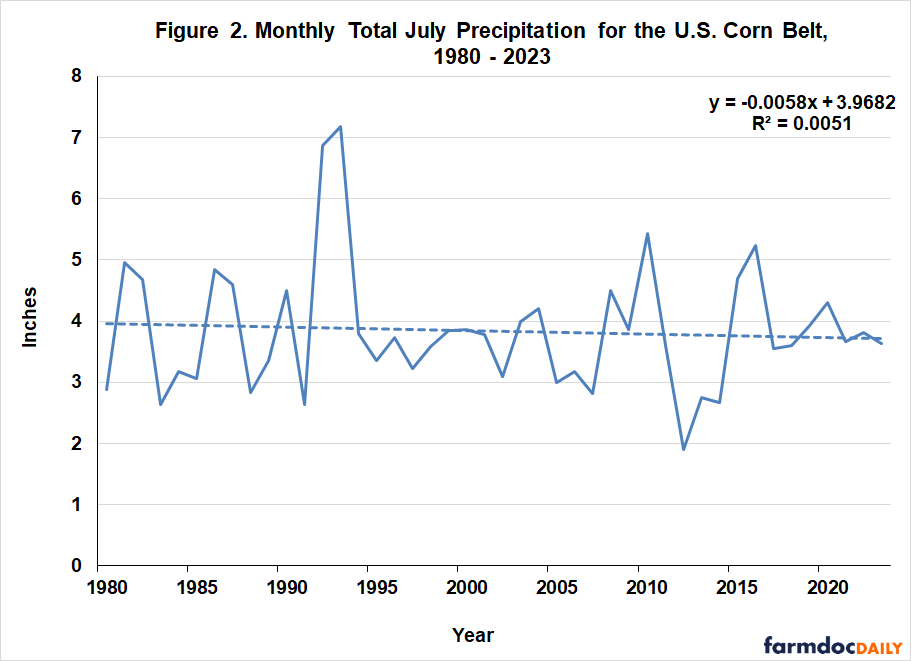
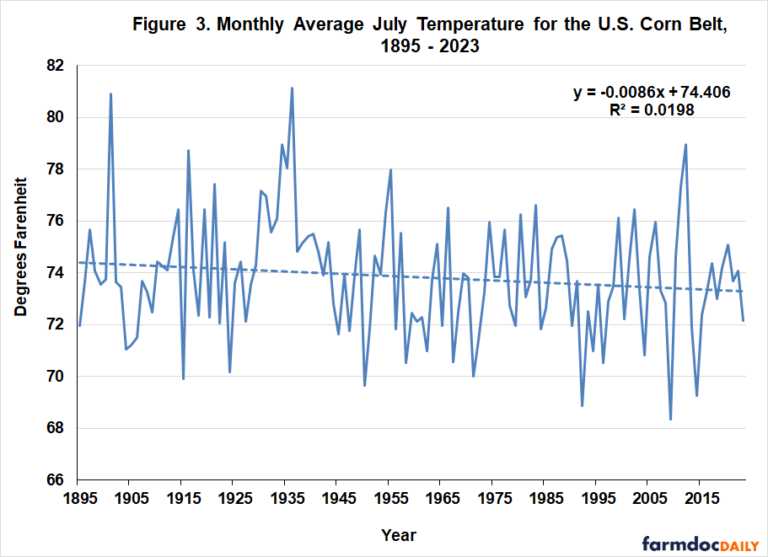
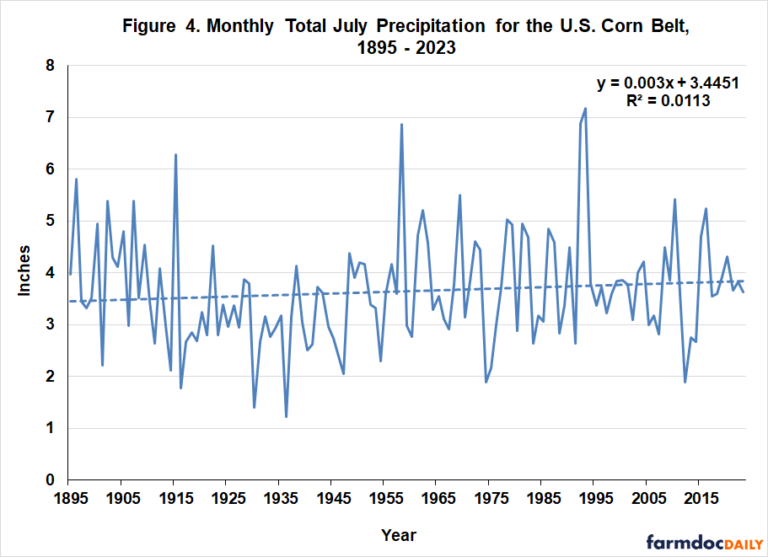
Figures 1 and 2 show monthly observations for July temperature and precipitation, respectively, over 1980 through 2023. These are the two most important variables determining the U.S average corn yield in any given year (farmdoc daily, October 9, 2023; April 8, 2024). There is a slight downward linear trend in both variables since 1980. There is, of course, large variation through time in both July temperature and precipitation. The sample period for both variables is extended back to 1895 in Figures 3 and 4. Using the longer sample, there is a slight downward trend in July temperature. Through the 1950s, the trend in July temperature was equal to or above 74 degrees Fahrenheit, whereas the trend was below 74 degrees in following years. July precipitation had a very small upward trend for the 1895 through 2023 sample.
An unavoidable impression from Figures 3 and 4 is just how bad the weather was during the 1930s, with extremely high July temperature and exceptionally low precipitation. The average July temperature for the Corn Belt in 1936 was 81.1 degrees, a record that has yet to be broken. Even during the historic drought of 2012, the average July temperature of 79 degrees was 2.1 degrees lower than the July 1936 record. Total July precipitation for the Corn Belt in 1936 was only 1.2 inches, a record low only challenged by the very low total in 1930.
Complete results for trends in all the Corn Belt weather variables are presented in Table 1. For each sample period, the estimated linear trend coefficient is presented along with the estimated starting and ending trend values and the change between the two. This latter information is shown to provide a sense of the magnitude of trends regardless of whether they are statistically significant or not. Trend coefficients that are statistically significant at the five-percent level are bolded in Table 1. Somewhat surprisingly, only one trend coefficient for the dozen weather variables considered is statistically significant in either sample. The upward trend in September temperature over 1980 through 2023 is statistically significant. The magnitude of the upward trend, 3.1 degrees, for the September average temperature during this period also stands out. The next largest upward trend in temperature is 1.8 degrees for June over 1980 through 2023, but this trend is not statistically significant.
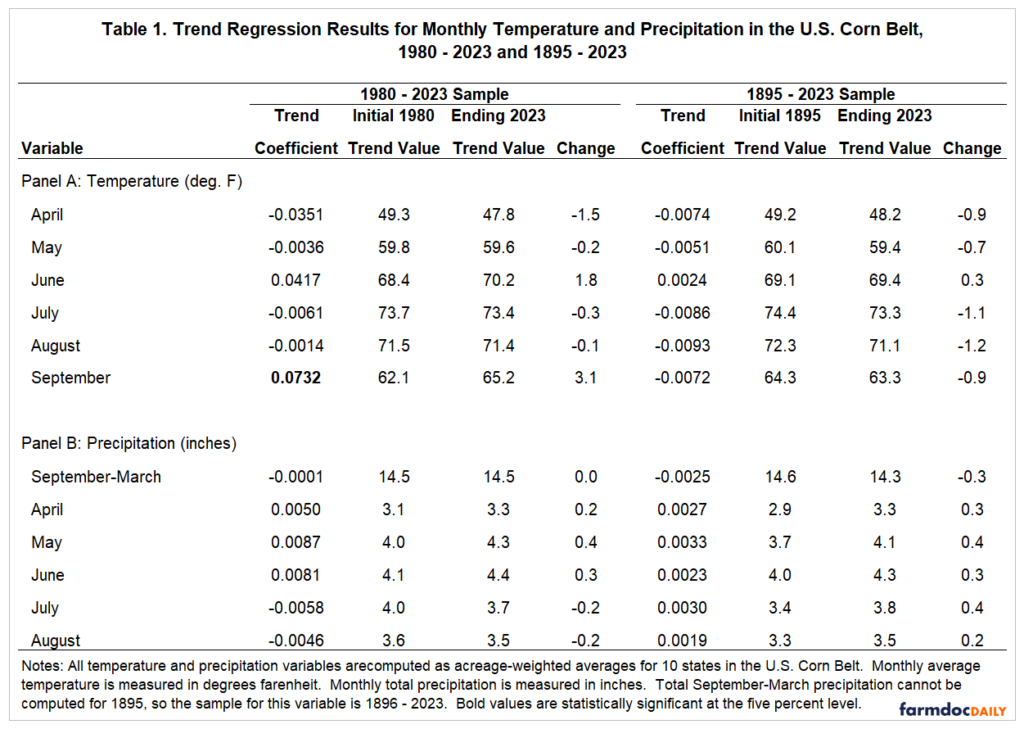
It is interesting to note that 9 of the 16 estimated temperature trend coefficients in Table 1 are negative. In a related fashion, 9 of the 12 estimated precipitation trend coefficients are positive. If anything, there has been a slight long-run decline in temperature and a very small rise in precipitation during the growing season for the U.S. Corn Belt.
The picture that emerges from this analysis is one of very little evidence of significant upward or downward trends in the monthly temperature and precipitation variables that drive the U.S. average corn yield. This lack of trends in important Corn Belt crop weather variables goes back over a century to 1895, when records from the National Weather Service begin. Until proven otherwise, one should be cautious in projecting large changes in growing season weather for the U.S. Corn Belt. At the same time, there is no guarantee that the lack of trends in crop weather variables documented here will persist into the future. Finally, even without significant climate trends, history shows there can be very bad stretches of growing season weather, such as the 1930s Dust Bowl years.
It is crucial to emphasize that the results presented in this article should not be construed as a refutation of global warming. As noted in the introduction, the U.S. Corn Belt is a tiny sliver of total global surface area, and therefore, the climate in this area cannot have much impact on global average temperature or precipitation trends. At the same time, the results provide interesting evidence that climate change has not necessarily proceeded uniformly across the world. It is also important to note that our results are consistent with other results in the climate change literature. Butler, Mueller, and Huybers (2018) analyzed weather trends for producing corn in the U.S. since 1981 and found that the weather was “peculiarly pleasant.”
Implications
Climate change is a term used to describe global-scale warming in the earth’s atmosphere due to increasing CO2 concentrations. This phenomenon is based on global averages and there may be substantial variation in climate change for different parts of the world. In this article, we examine trends in monthly temperature and precipitation during the growing season for the U.S. Corn Belt, which is a tiny sliver of global surface area but looms large in global grain production. Two sample periods are used in the analysis—1980-2023 and 1895-2023. Somewhat surprisingly, only one trend coefficient for the dozen weather variables considered is statistically significant in either sample period. Hence, there is very little evidence of significant upward or downward trends in the monthly temperature and precipitation variables that are most crucial for determining the U.S. average corn yield. Until proven otherwise, one should be cautious in projecting large changes in growing season weather for the U.S. Corn Belt. At the same time, there is no guarantee that the lack of trends in crop weather variables documented in this article will persist into the future. It is crucial to emphasize that the results should not be construed as a refutation of global warming. As noted above, the U.S. Corn Belt is a tiny sliver of total global surface area, and therefore, the climate in this area cannot have much impact on global average temperature or precipitation trends. Lastly, it is important to recognize that the results are based on monthly average temperature and total precipitation, which may mask trends in more granular weather observations through time and space.
Source : illinois.edu