By Bradley Zwilling
Agricultural debt on a nominal basis in Illinois has been increasing since 1991. Data from the U.S. Department of Agriculture (USDA) and Illinois Farm Business Farm Management (FBFM) are shown to see if increasing debt levels pose problems for the financial health of Illinois farms. With projected lower incomes and higher interest rates, increasing debt levels need to be monitored closely.
Overall Agricultural Debt Levels
USDA publishes estimates of total agricultural debt outstanding in the United States (see Economic Reporting Service, USDA website at http://www.ers.usda.gov/, Farm Income and Wealth Statistics). This series is available from 1960 onwards and gives the amount of agricultural debt outstanding as of the year-end.
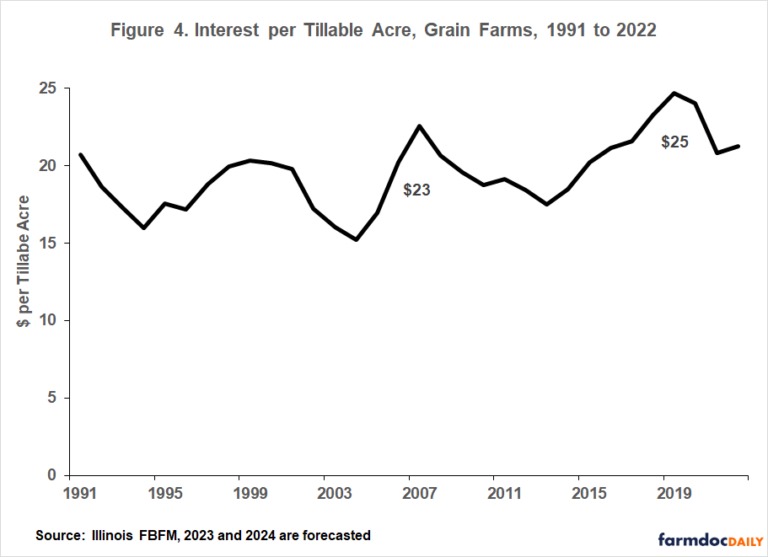
Nominally, agricultural debt reached a peak in 1984 of $188.8 billion (see the nominal line in Figure 1). From 1984 through 1989, agricultural producers retired debt and agricultural lenders wrote off some debt, resulting in a decline in total debt. By 1989, agricultural debt had declined by 31%, reaching a level of $131 billion.
Since 1990, agricultural debt increased an average of 4.2% per year. The rate of increase varied from year-to-year but exhibited no escalating or decreasing trends. The highest rate increases occurred between 2006-2007 and 2013-2014 when increases were 11.6% and 9.5%, respectively. Increases of less than 3% occurred nine times in this period while decreases happened in 3 years with the greatest at negative 3.2% in 2002-2003.
At the end of 2004, agricultural debt reached $197.6 billion, surpassing the previous high set in 1984. Increasing debt levels may cause concerns that financial stress occurring during the 1980s may repeat. However, the above debt levels are stated in nominal terms and do not take into consideration inflation’s devaluing impacts on the dollar.
Using the gross national product – implicit price deflator to state nominal debt levels in terms of 2024 dollars gives a different picture of debt levels (see the real line in Figure 1). In terms of 2024 dollars, agricultural debt started at $515 billion in 1980 before declining until 1994. Since 1993, agricultural debt in real terms increased in all but four years 2000, 2003, 2012 and 2022. Since 1990, the rate of increase averaged 1.9% for real debt levels, lower than the 4.2% nominal rate increase. The number forecasted for 2024 is the highest level in real terms ever with 2021’s value of $537 billion being the second highest.
Debt Levels on Illinois FBFM Grain Farms
Additional perspective on debt can be obtained by analyzing farm level data from FBFM. We will look at average data for grain farms enrolled in FBFM who have certified-useable balance sheets. The data is stated in nominal terms, and debt levels are stated as of year-end 1991 through 2022 and forecasted for 2023 and 2024. Three measures of debt level are presented using FBFM data: debt-to-asset ratio, debt and assets per tillable acre, and interest expense per tillable acre.
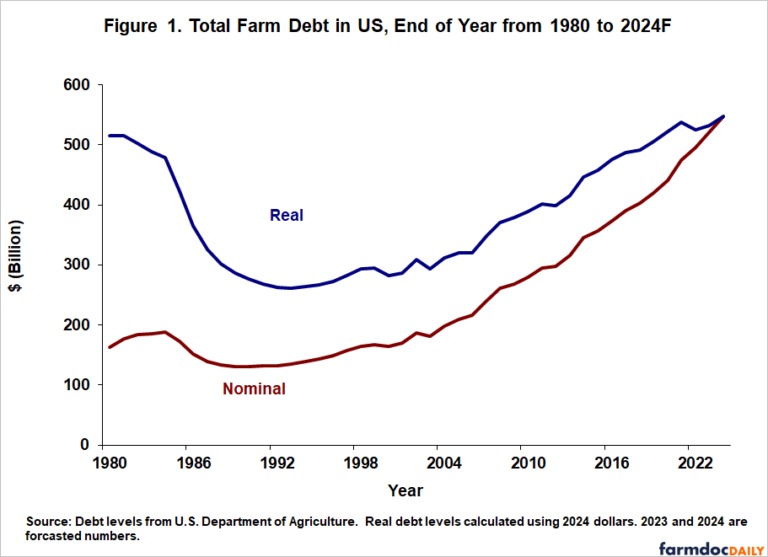
The debt-to-asset ratio in Figure 2 had a very slight downward trend from 1993 to 2002. In 1993 and 2002, the debt-to-asset ratio was the same at 30.7%. From 2003 to 2012, the debt-to-asset ratio decreased at a faster pace, averaging 5.2%. In 2003 and 2012, the debt-to-asset ratios were 29.2% and 18.0%, respectively. Since 2012 until 2019, the debt-to-asset ratio has increased 2.6% annually. 2020, 2021 and 2022 have had negative increases, with the 2022 ratio dropping 1.0% from 2021. Using the USDA nominal projections, 2023 and 2024 are forecasted to increase after three straight years of decreases. 19.4 and 19.5 are the forecasted debt-to-asset ratio for 2023 and 2024, respectively.
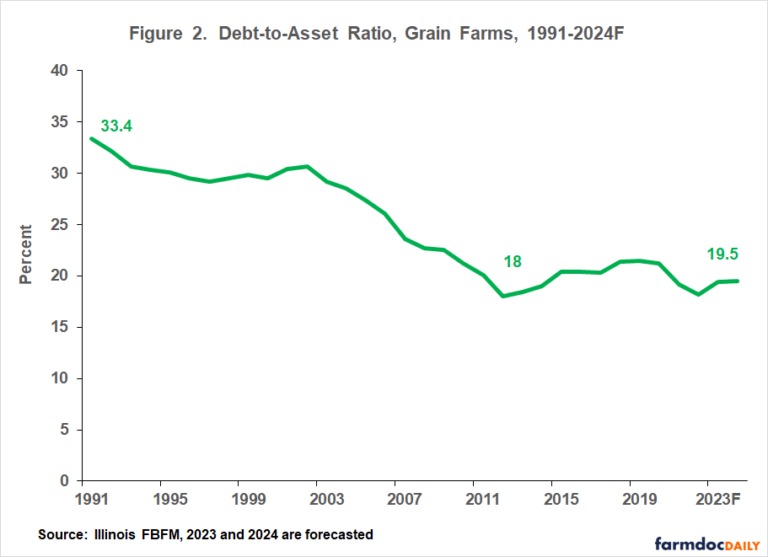
Figure 3 helps to see the changes in debt-to-assets by looking at assets and debt. Increases in debt and assets can be seen by examining these on a per tillable acre. Since 1991, both asset and liability levels rose, with asset levels increasing slightly faster than debt levels until about 2003 when assets increased much more rapidly. Debt levels were $258 per tillable acre in 1991 compared to $357 in 2003, an increase of almost $100 per acre while assets increased more than $400 per acre. Since 2003, debt levels per tillable acre increased more than $450 per acre. Assets per tillable acre increased more than $2,900 per tillable acre during the same period. Between 1991 and 2003, debt per tillable acre increased an average of 2.8%, which is like all U.S. agricultural debt yearly increase of 2.7% on a nominal basis during that same period of time. Assets per tillable acre on Illinois FBFM grain farms averaged an increase of 3.4% during this same period. However since 2003, Illinois FBFM grain farms debt per tillable acre increased 4.5%, which is about the same as the national average of 5.4% on a nominal basis. Assets per tillable acre for that time period increased 6.0%. In 2021 and 2022, we saw increases of 6.3% and 9.6% respectively, with the 2022 value being the highest during this period. 2023 is projected to see a 4.0% increase to $790 per tillable acre, while 2024 is projected to see a 3.2% increase to a value of $816 per tillable acre.
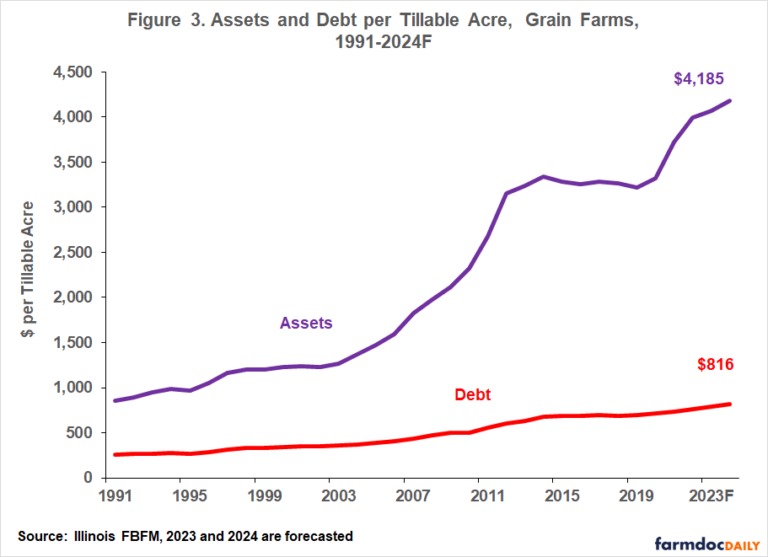
While debt levels have increased, interest expense per tillable acre (Figure 4) declined from 1999 to 2013, except for 2005, 2006, and 2007 which saw double-digit increases of 11.7%, 18.9% and 11.8%, respectively as well as 2.0% in 2011. Interest per tillable acre has been increasing since 2013 until a decrease in 2020 of 2.8%. The largest decrease in interest paid per tillable acre during this period was in 2021 with 15.8%. 2022 also had a decrease of 11.6%. This is the first three years in a row decrease since 2008 to 2010 period. Interest expenses were $20.72 per tillable acre in 1991 and $18.63 in 1992, while in 2021 and 2022 interest expenses per tillable acre were $20.81 and $21.23, respectively. Lower interest rates in the late 1990s and early 2000s caused the reduction in interest expense per tillable acre in the face of rising debt levels per acre. However, an interest rate increase in the mid-2000s caused an increase in interest expense per tillable acre during that period. From the mid-2000s until 2013, interest rates have decreased, but the amount of debt was increasing more rapidly. Interest rates have been historically low but increasing debt levels from 2013 to 2019 have led to interest expenses per tillable acre increasing an average 6.0% per year. Even though interest paid per tillable acre has decreased the last 3 years from the highest level during this period of 2019, interest rate increases in 2022 that continue in 2023 and 2024 will lead to interest expense increases for those years, especially with rising debt levels on a per tillable acre basis.