This article will look at the differences in working capital to gross revenue (WC to GR) among farm types, level of gross sales and by net income. The information is from data collected in FINBIN at the Center for Farm Financial Management, University of Minnesota. The regional area queried for this article is farms reporting from South Dakota, North Dakota, Nebraska and Minnesota. In general, working capital declined from 2013 to 2019 and has increased since that time.
The five general financial measures used when evaluating the financial performance of a farm include liquidity, solvency, profitability, repayment capacity and financial efficiency. The current ratio, working capital and working capital to gross revenue are used to evaluate liquidity for the farm business.
Working Capital to Gross Revenue by Farm Type
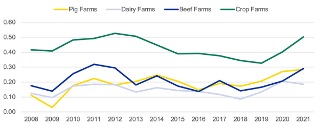
Figure 1. South Dakota, North Dakota, Nebraska and Minnesota Farms, Working Capital to Gross Revenue by Farm Type. Source: CFFM UMN FINBIN Website, SDSU Extension
Figure 1 shows the average measurement of WC to GR by farm type. The four farm types are: pig, dairy, beef and crop farms, with the majority of revenue derived from their type.
The WC to GR declined from 2012 to 2019 for the majority of farm types. Pig farms improved on WC to GR during this time and have continued to improve into 2021. The high grain prices started tapering off in 2013, and financial performance declined as farm incomes dropped into 2019. Since 2019, higher grain prices have led to increasing farm incomes and increasing of working capital.
Livestock farms appear to be more volatile in this measure, with the low 0.03 for pig farms in 2009 and beef farms reaching a high of 0.32 in 2011 before declining into 2018. Since 2018, beef and pig farms have risen to 0.29 as of 2021. Dairy farms tend to have lower liquidity, as a majority of the investment is in longer-term assets, and the recurrent income in milk sales permits them to continue on less liquidity.
The grain farms in this data set reached a high WC to GR in 2012 at 0.53 then declined into 2019 and reached the low at 0.33. Since 2019’s low, the WC to GR for grain farms has risen to 0.50 in 2021.
Working Capital to Gross Revenue by Gross Sales
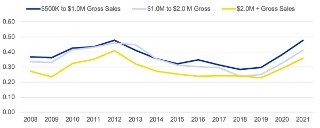
Figure 2 displays average working capital to gross revenue by size of operation as measured by gross revenue. The groups are divided into three levels: $500K to $1.0M, $1.0M to $2.0M and $2.0M + in gross revenue.
The early peak was reached in 2012 by all groups, then declined into 2019 before turning up into 2021. The $500K to $1.0M group retuned to its 2012 high at 0.48 in 2021. The middle group ($1.0M to $2.0M) early peak was at 0.46 declining to a low 0.24 in 2018 and moving up to 0.41 by 2021.
The high-volume gross sales group peaked at 0.41 in 2012 and fell below the safe target at 0.30 in 2013, while reaching the low in 2019 at 0.23. This group’s working capital to gross revenue recovered to 0.36 in 2021.
On average, the working capital to gross revenue is higher for farms at the $500K to $2.0M gross sales level than the larger farms with gross sales of $2.0M +. All groups have returned to a safe target greater than 0.31 in 2021.
Working Capital to Gross Revenue by Net Income Level
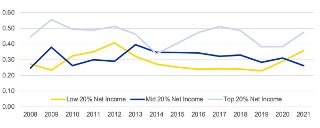
Figure 3. South Dakota, North Dakota, Nebraska and Minnesota Farms, Working Capital to Gross Revenue by Net Income Level. Source: CFFM UMN FINBIN Website, SDSU Extension
Figure 3 shows working capital to gross revenue by net income level. The information in FINBIN may be queried by net income levels. The three groups in Figure 3 are the low 20% of net income, middle 20% and high 20%.
The top 20% has maintained a strong WC to GR level, reaching their low in 2009 at 0.34 and then returning to a strong target of 0.47 in 2021. The mid-level group reached their peak in 2014 at 0.40 and have since declined. This group has a slow trend of decreasing below the strong target at 0.30 to 0.26 in 2021. The low-income group peaked in 2012 at 0.41, declined below the strong target in 2019 at 0.23 and increased to a stronger target by 2021 at 0.36.
Conclusion
Liquidity will be key to keeping a strong financial position as volatility in market prices remains high, input prices increasing, while inflation and interest rates keep rising. Liquidity and working capital offer a first line of defense to work through tighter margins or take advantage of opportunities that may arise.
Source :