Overview
Wheat was up; soybeans were mixed; corn and cotton were down for the week.
Is now the time to buy? It’s currently the most common question I receive from producers, colleagues, and bankers. The answer, like most economic questions, is it depends. First of all, no one has a crystal ball that can predict the future, so there are risks to any transaction that need to be fully understood before entering a position in the futures market.
A few quick points: 1) speculation and risk management (hedging) are not the same thing, so make sure you know what you are trying to accomplish and do not confuse the two; 2) most likely we will continue to see volatility in agricultural markets in the short term. The erratic nature of commodity markets is indicative of a lack of understating of the short-term implications for agricultural commodities due to the COVID-19 pandemic; and 3) the long term ramifications of the global pandemic on agricultural markets, logistics, food safety, government programs, production, and consumption are highly uncertain.
As such, unless you have the stomach for dramatic swings in prices and the appetite for large losses or payoffs, short term speculative trading is probably not the best route to go. However, agricultural commodity options can provide lower risk, short-term strategies worth exploring if you care to speculate in the market.
Long-term, if you have the liquidity and sufficient time horizon, now may represent an opportunity to buy, but you must be willing to take on the short term volatility and the long term risk that current circumstances could get worse and have long lasting repercussions. It is also important to note that if you are considering entering futures or options positions for the purpose of speculation, do not put money on the table that you cannot afford to lose.
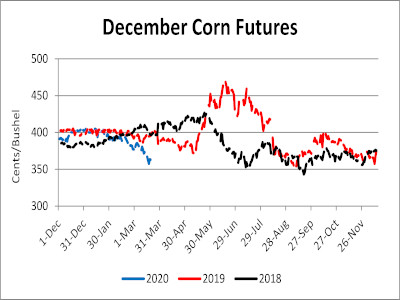
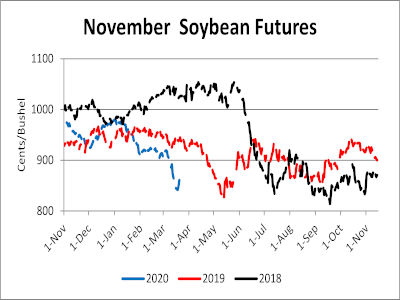
December corn futures closed at $3.63 ¼ and this week the nearby contract established its lowest price ($3.32) since July 2018. November soybeans set a new contract low this week of $8.36 ¾ and nearby futures achieved its lowest point ($8.21) since May 2019. December cotton futures closed at 55.03 and the nearby contact set a new 10-year low today at 53.20. More than most commodities cotton is tied closely to global economic activity as, in general, clothing and other apparel purchases are not a necessity and can be delayed, unlike food.
Lastly, it is important to remember that prices can always go lower, so weigh the risks and rewards to determine if you are willing to enter a speculative position.
| Previous | Current | Change |
USD Index | 98.73 | 103.48 | 4.74 |
Crude Oil | 31.78 | 23.57 | -8.21 |
DJIA | 21,887 | 19,161 | -2,726 |
Corn
Ethanol production for the week ending March 13 was 1.035 million barrels per day, down 9,000 barrels from the previous week. Ethanol stocks were 24.589 million barrels, up 0.264 million barrels compare to last week. Corn net sales reported by exporters for March 6-12 were down compared to last week with net sales of 35.6 million bushels for the 2019/20 marketing year and 2.2 million bushels for the 2020/21 marketing year. Exports for the same time period were up 14% from last week at 38.2 million bushels. Corn export sales and commitments were 66% of the USDA estimated total exports for the 2019/20 marketing year (September 1 to August 31) compared to the previous 5-year average of 78%. Across Tennessee, average corn basis (cash price-nearby futures price) weakened at Memphis, Northwest Barge Points, Northwest, and Upper-middle Tennessee. Overall, basis for the week ranged from 2 over to 29 over, with an average of 14 over the May futures at elevators and barge points. May 2020 corn futures closed at $3.43, down 22 cents since last Friday. For the week, May 2020 corn futures traded between $3.32 and $3.67. May/Jul and May/Dec future spreads were 6 and 20 cents. July 2020 corn futures closed at $3.49, down 19 cents since last Friday.
Corn | May 20 | Change | Dec 20 | Change |
Price | $3.43 | -$0.22 | $3.63 | -$0.10 |
Support | $3.27 | -$0.32 | $3.50 | -$0.16 |
Resistance | $3.63 | -$0.12 | $3.77 | -$0.01 |
20 Day MA | $3.67 | -$0.09 | $3.75 | -$0.07 |
50 Day MA | $3.80 | -$0.04 | $3.87 | -$0.04 |
100 Day MA | $3.85 | -$0.03 | $3.92 | -$0.03 |
4-Week High | $3.86 | -$0.01 | $3.89 | -$0.04 |
4-Week Low | $3.32 | -$0.31 | $3.55 | -$0.15 |
Technical Trend | Strong Down | = | Strong Down | = |
In Tennessee, new crop cash corn contracts ranged from $3.32 to $3.67. December 2020 corn futures closed at $3.63, down 10 cents since last Friday. Downside price protection could be obtained by purchasing a $3.70 December 2020 Put Option costing 31 cents establishing a $3.39 futures floor.
Soybeans
Net sales reported by exporters were up compared to last week with net sales of 23.2 million bushels for the 2019/20 marketing year and 2.6 million bushels for the 2020/21 marketing year. Exports for the same period were down 15% compared to last week at 17.8 million bushels. Soybean export sales and commitments were 70% of the USDA estimated total annual exports for the 2019/20 marketing year (September 1 to August 31), compared to the previous 5-year average of 90%. Average soybean basis strengthened at Northwest Barge Points and weakened at Memphis, Northwest, and Upper-middle Tennessee. Basis ranged from 28 under to 29 over the May futures contract at elevators and barge points. Average basis at the end of the week was 11 over the May futures contract. May 2020 soybean futures closed at $8.62, up 14 cents since last Friday. For the week, May 2020 soybean futures traded between $8.21 and $8.64. May/Jul and May/Nov future spreads were 2 and -2 cents. July 2020 soybean futures closed at $8.64, up 8 cents since last Friday. May soybean-to-corn price ratio was 2.51 at the end of the week.
Soybeans | May 20 | Change | Nov 20 | Change |
Price | $8.62 | $0.14 | $8.60 | -$0.04 |
Support | $8.38 | -$0.03 | $8.40 | -$0.14 |
Resistance | $8.76 | -$0.06 | $8.76 | -$0.19 |
20 Day MA | $8.72 | -$0.17 | $8.88 | -$0.18 |
50 Day MA | $8.97 | -$0.13 | $9.16 | -$0.12 |
100 Day MA | $9.19 | -$0.07 | $9.36 | -$0.07 |
4-Week High | $9.12 | $0.00 | $9.24 | -$0.03 |
4-Week Low | $8.21 | -$0.24 | $8.36 | -$0.24 |
Technical Trend | Strong Down | = | Strong Down | = |
In Tennessee, new crop soybean cash contracts ranged from $7.98 to $8.61. Nov/Dec 2020 soybean-to-corn price ratio was 2.37 at the end of the week. November 2020 soybean futures closed at $8.60, down 4 cents since last Friday. Downside price protection could be achieved by purchasing an $8.80 November 2020 Put Option which would cost 55 cents and set an $8.25 futures floor.
Cotton
Net sales reported by exporters were down compared to last week with net sales of 340,700 bales for the 2019/20 marketing year and 78,500 bales for the 2020/21 marketing year. Exports for the same time period were down 13% compared to last week at 369,500 bales. Upland cotton export sales were 97% of the USDA estimated total annual exports for the 2019/20 marketing year (August 1 to July 31), compared to the previous 5-year average of 90%. Delta upland cotton spot price quotes for March 19 were 51.18 cents/lb (41-4-34) and 53.43 cents/lb (31-3-35). Adjusted World Price (AWP) decreased 3.09 cents to 49.95 cents. May 2020 cotton futures closed at 53.68 cents, down 6.81 cents since last Friday. For the week, May 2020 cotton futures traded between 53.20 and 59.72 cents. May/Jul and May/Dec cotton futures spreads were 0.06 cents and 1.35 cents. July 2020 cotton futures closed at 53.74 cents, down 7.02 cents since last Friday.
Cotton | May 20 | Change | Dec 20 | Change |
Price | 53.68 | -6.81 | 55.03 | -6.19 |
Support | 51.26 | -6.71 | 52.98 | -6.45 |
Resistance | 57.56 | -4.91 | 58.30 | -4.79 |
20 Day MA | 61.25 | -3.16 | 62.18 | -3.03 |
50 Day MA | 66.45 | -1.44 | 67.07 | -1.38 |
100 Day MA | 67.07 | -0.50 | 67.80 | -0.46 |
4-Week High | 69.36 | -0.88 | 69.95 | -0.70 |
4-Week Low | 53.20 | -5.37 | 54.62 | -5.38 |
Technical Trend | Strong Down | = | Strong Down | = |
December 2020 cotton futures closed at 55.03, down 6.19 cents since last Friday. Downside price protection could be obtained by purchasing a 56 cent December 2020 Put Option costing 5.1 cents establishing a 50.9 cent futures floor.

Wheat
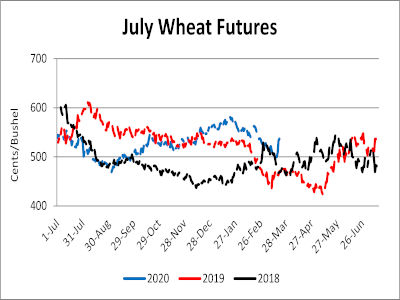
Wheat net sales reported by exporters were up compared to last week with net sales of 12.4 million bushels for the 2019/20 marketing year and 5.3 million bushels for the 2020/21 marketing year. Exports for the same time period were down 17% from last week at 13.7 million bushels. Wheat export sales were 88% of the USDA estimated total annual exports for the 2019/20 marketing year (June 1 to May 31), compared to the previous 5-year average of 98%. May 2020 wheat futures closed at $5.39, up 33 cents since last Friday. May 2020 wheat futures traded between $4.91 and $5.47 this week. May wheat-to-corn price ratio was 1.57. May/Jul and May/Sep future spreads were -4 and -1 cents.
Wheat | May 20 | Change | Jul 20 | Change |
Price | $5.39 | $0.33 | $5.35 | $0.28 |
Support | $4.96 | $0.05 | $5.24 | $0.31 |
Resistance | $5.60 | $0.42 | $5.47 | $0.29 |
20 Day MA | $5.20 | -$0.10 | $5.20 | -$0.10 |
50 Day MA | $5.45 | -$0.04 | $5.45 | -$0.04 |
100 Day MA | $5.39 | -$0.01 | $5.41 | $0.00 |
4-Week High | $5.68 | $0.00 | $5.67 | $0.00 |
4-Week Low | $4.91 | -$0.06 | $4.94 | -$0.04 |
Technical Trend | Up | + | Flat | - |
In Tennessee, June/July 2020 cash contracts ranged from $5.11 to $5.71. July 2020 wheat futures closed at $5.35, up 28 cents since last Friday. Downside price protection could be obtained by purchasing a $5.40 July 2020 Put Option costing 36 cents establishing a $5.04 futures floor. July wheat-to-corn price ratio was 1.53. September 2020 wheat futures closed at $5.38, up 25 cents since last Friday.
Source : tennessee.edu