Overview
Corn, cotton, and soybeans were up; and wheat was down for the week.
USDA changes to 2020/21 marketing year supply and demand estimates from May through November have been substantial and are reflective of the dramatic August –November price rally in corn and soybeans, where the 2020 harvest contracts gained $3.37 for soybeans and $1.03 for corn.
In May, USDA projected corn harvested acreage at 89.6 million acres, national average yield at 178.5 bpa, production at 15.995 billion bushels, exports at 2.15 billion bushels, and ending stocks at 3.318 billion bushels. November estimates are 82.5 million harvested acres (down 7.1 million acres), national average yield at 175.8 bpa (down 2.7 bpa), production at 14.507 billion bushels (down 1.488 billion bushels), exports at 2.65 billion bushels, (up 500 million bushels), and ending stocks at 1.702 billion bushels (down 1.616 billion bushels). The dramatic changes show the production challenges (drought, storms, etc) that large portions of the Corn Belt experienced and the very strong export sales.
Soybeans also had dramatic adjustments. However, they were more pronounced on the demand side. Soybean harvested acres in May were projected at 82.8 million, national average yield at 49.8 bpa, and production at 4.125 billion bushels. The November USDA estimates indicated harvested acres at 82.3 million (down 0.5 million), yield at 50.7 bpa (up 0.9 bpa), and production at 4.17 billion bushels (up 45 million bushels). Demand and ending stocks indicated crush increasing from 2.13 to 2.18 billion bushels (up 50 million), exports increasing from 2.05 to 2.2 billion bushels (up 150 million), and ending stocks decreasing 215 million bushels from 405 to 190 million bushels.
After factoring in the May through November adjustments, stocks-to-use for corn were reduced from 22% to 11% and soybeans from 9% to 4%. Current stock-to use ratios are supportive of maintaining (or increasing) current price levels. 2020 has been an incredibly challenging year, but corn and soybean prices look like they will finish the year on a positive note.
Corn
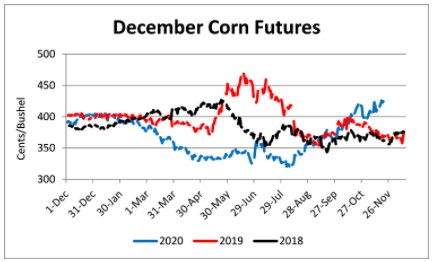
Ethanol production for the week ending November 13 was 0.962 million barrels per day, down 15,000 barrels from the previous week. Ethanol stocks were 20.203 million barrels, up 0.044 million barrels compared to last week. Corn net sales reported by exporters for November 5-12 were up compared to last week with net sales of 42.9 million bushels for the 2020/21 marketing year. Exports for the same time period were up 16% from last week at 33.3 million bushels. Corn export sales and commitments were 52% of the USDA estimated total exports for the 2020/21 marketing year (September 1 to August 31) compared to the previous 5-year average of 40%.
Corn | Dec 20 | Change | Mar 21 | Change |
Price | $4.23 | $0.13 | $4.28 | $0.09 |
Support | $4.15 | $0.17 | $4.20 | $0.12 |
Resistance | $4.29 | $0.06 | $4.33 | $0.01 |
20 Day MA | $4.11 | $0.02 | $4.17 | $0.03 |
50 Day MA | $3.95 | $0.06 | $4.02 | $0.06 |
100 Day MA | $3.68 | $0.04 | $3.77 | $0.04 |
4-Week High | $4.28 | $0.00 | $4.35 | $0.00 |
4-Week Low | $3.93 | $0.05 | $3.96 | $0.01 |
Technical Trend | Up | = | Up | = |
Nationally the Crop Progress report estimated corn harvested at 95% compared to 91% last week, 73% last year, and a 5-year average of 87%. In Tennessee, the Crop Progress report estimated corn harvested at 99% compared to 97% last week, 100% last year, and a 5-year average of 99%. Across Tennessee, average corn basis (cash price-nearby futures price) strengthened or remained unchanged at North-Central, Mississippi River, West-Central, and West and weakened at Northwest elevators and barge point. Overall, basis for the week ranged from 20 under to 21 over, with an average of 6 over the December futures. December 2020 corn futures closed at $4.23, up 13 cents since last Friday. For the week, December 2020 corn futures traded between $4.09 and $4.28. Dec/Mar and Dec/Dec future spreads were 5 and -15 cents. March 2021 corn futures closed at $4.28, up 9 cents since last Friday. December 2021 corn futures closed at $4.08, up 4 cents since last Friday. Downside price protection could be obtained by purchasing a $4.10 December 2021 Put Option costing 34 cents establishing a $3.79 futures floor.
Soybeans
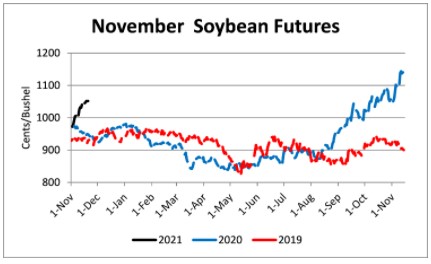
Net sales reported by exporters were down compared to last week with net sales of 51.0 million bushels for the 2020/21 marketing year. Exports for the same period were down 20% compared to last week at 94.0 million bushels. Soybean export sales and commitments were 86% of the USDA estimated total annual exports for the 2020/21 marketing year (September 1 to August 31), compared to the previous 5-year average of 58%.
Soybeans | Jan 21 | Change | Nov 21 | Change |
Price | $11.81 | $0.33 | $10.49 | $0.09 |
Support | $11.54 | $0.22 | $10.36 | $0.17 |
Resistance | $11.93 | $0.33 | $10.59 | $0.04 |
20 Day MA | $11.14 | $0.26 | $10.09 | $0.17 |
50 Day MA | $10.67 | $0.19 | $9.84 | $0.10 |
100 Day MA | $9.91 | $0.15 | $9.46 | $0.09 |
4-Week High | $11.96 | $0.34 | $10.59 | $0.14 |
4-Week Low | $10.45 | $0.07 | $9.61 | $0.00 |
Technical Trend | Up | = | Up | = |
Nationally the Crop Progress report estimated soybeans harvested at 96% compared to 92% last week, 89% last year, and a 5-year average of 93%. In Tennessee, soybeans harvested at 80% compared to 71% last week, 84% last year, and a 5-year average of 83%. Across Tennessee, average soybean basis strengthened at Mississippi River, West, West-Central, North-Central, and Northwest elevators and barge points. Basis ranged from 35 under to 6 over the January futures contract. Average basis at the end of the week was 12 under the January futures contract. January 2021 soybean futures closed at $11.81, up 33 cents since last Friday. For the week, January 2021 soybean futures traded between $11.44 and $11.96. Jan/Mar and Jan/Nov future spreads were 0 and -132 cents. March 2021 soybean futures closed at $11.81, up 33 cents since last Friday. November 2021 soybean futures closed at $10.49, up 9 cents since last Friday. Downside price protection could be achieved by purchasing a $10.60 November 2021 Put Option which would cost 73 cents and set a $9.87 futures floor. Nov/Dec 2021 soybean-to-corn price ratio was 2.57 at the end of the week.
Cotton
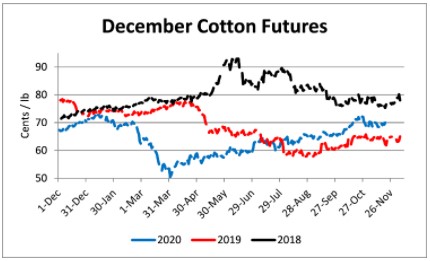
Net sales reported by exporters were down compared to last week with net sales of 131,400 bales for the 2020/21 marketing year. Exports for the same time period were down 5% compared to last week at 277,300 bales. Upland cotton export sales were 68% of the USDA estimated total annual exports for the 2020/21 marketing year (August 1 to July 31), compared to the previous 5-year average of 61%. Delta upland cotton spot price quotes for November 19 were 68.42 cents/lb (41-4-34) and 70.67 cents/lb (31-3-35). Adjusted World Price (AWP) increased 0.13 cents to 56.84 cents.
Cotton | Dec 20 | Change | Mar 21 | Change |
Price | 70.88 | 2.42 | 72.96 | 2.56 |
Support | 68.55 | 0.62 | 71.17 | 1.30 |
Resistance | 72.41 | 3.38 | 73.95 | 2.94 |
20 Day MA | 69.78 | -0.39 | 71.28 | -0.01 |
50 Day MA | 68.40 | 0.52 | 69.46 | 0.63 |
100 Day MA | 65.97 | 0.46 | 66.90 | 0.54 |
4-Week High | 72.60 | 0.00 | 73.27 | 0.00 |
4-Week Low | 68.06 | 0.00 | 68.91 | 0.00 |
Technical Trend | Down | = | Up | + |
Nationally, the Crop Progress report estimated cotton harvested at 69% compared to 61% last week, 66% last year, and a 5-year average of 64%. In Tennessee, cotton harvested was estimated at 78% compared to 64% last week, 77% last year, and a 5-year average 82%. December 2020 cotton futures closed at 70.88, up 2.42 cents since last Friday. For the week, December 2020 cotton futures traded between 68.4 and 71.25 cents. Dec/Mar and Dec/Dec cotton futures spreads were 2.04 cents and -0.31 cents. March 2021 cotton futures closed at 72.96 cents, up 2.56 cents since last Friday. December 2021 cotton futures closed at 70.57 cents, up 1.72 cents since last Friday. Downside price protection could be obtained by purchasing a 71 cent December 2021 Put Option costing 5.41 cents establishing a 65.59 cent futures floor.
Wheat
Wheat net sales reported by exporters were down compared to last week with net sales of 7.1 million bushels for the 2020/21 marketing year. Exports for the same time period were down 24% from last week at 9.9 million bushels. Wheat export sales were 66% of the USDA estimated total annual exports for the 2020/21 marketing year (June 1 to May 31), compared to the previous 5-year average of 67%.
Wheat | Dec 20 | Change | Jul 21 | Change |
Price | $5.93 | $0.00 | $5.98 | -$0.04 |
Support | $5.83 | $0.09 | $5.93 | $0.09 |
Resistance | $6.04 | -$0.02 | $6.09 | -$0.04 |
20 Day MA | $6.02 | -$0.08 | $6.02 | -$0.03 |
50 Day MA | $5.90 | $0.05 | $5.92 | $0.05 |
100 Day MA | $5.60 | $0.05 | $5.66 | $0.04 |
4-Week High | $6.37 | -$0.01 | $6.24 | $0.00 |
4-Week Low | $5.80 | $0.00 | $5.86 | $0.00 |
Technical Trend | Down | = | Up | = |
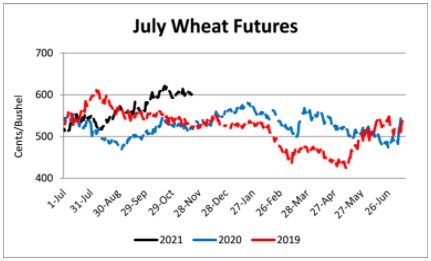
Nationally the Crop Progress report estimated winter wheat condition at 46% good-to-excellent and 18% poor-to-very poor; winter wheat planted at 96% compared to 93% last week, 94% last year, and a 5-year average of 94%; and winter wheat emerged at 85% compared to 79% last week, 82% last year, and 5-year average of 84%. In Tennessee, winter wheat condition was estimated at 67% good-to-excellent and 5% poor-to-very poor; winter wheat planted was estimated at 85% compared to 78% last week, 77% last year, and a 5-year average of 80%; and winter wheat emerged at 69% compared to 60% last week, 55% last year, and a 5-year average of 59%. December 2020 wheat futures closed at $5.93, unchanged since last Friday. December 2020 wheat futures traded between $5.86 and $6.04 this week. December wheat-to-corn price ratio was 1.40. Dec/Mar and Dec/Jul future spreads were 6 and 5 cents. March 2021 wheat futures closed at $5.99, down 3 cents since last Friday. In Tennessee, new crop wheat cash contracts ranged from $5.87 to $6.17. July 2021 wheat futures closed at $5.98, down 4 cents since last Friday. Downside price protection could be obtained by purchasing a $6.00 July 2021 Put Option costing 41 cents establishing a $5.59 futures floor.
Source : tennessee.edu