By ZACHARY LARSON
The final week in August marked Penn State Extension’s fourth annual Crop Conditions Tour. The event takes a snapshot of growing conditions across the state and offers some basic insights for the 2021 growing season. For this year’s tour, extension educators visited over 110 corn and soybean fields across the state, sampling sites with typical management practices for their respective counties. This year’s crop, while variable from field to field and even within the same field, appears to be promising for yield and quality.
Consistent heat and precipitation
The word “normal" rarely describes the weather in a growing season, but this year’s growing degree day (GDD) accumulation and precipitation was within historical averages for much of the state. Most places started the growing season with slightly above-average growing degree accumulation, and that trend continued throughout the year, with the sites tracked in our Crop Conditions Report at 36 to 119 GDDs above the 15-year average as of last week. However, our most recent 15 years has been much warmer than the prior 15, which means that the heat we saw this year is 150 to 250 GDDs more than our 30-year average.
Rainfall, while spotty from month to month and field to field, was again “normal," as many areas ended very close to their 10-year averages, with 5 of the 8 sites we surveyed within one inch of the average as of last week. Overall, the pattern was a drier spring, with rainfall catching up as the season progressed. Some portions of the southwest and south-central part of the state were dry, with drought conditions affecting parts of Franklin County. The opposite occurred across the northern tier with parts of Bradford County receiving significant rainfall in late June, pushing their average well above normal.
Corn conditions and outlook
Warmer and drier weather resulted in favorable planting conditions for many areas across the state, and most crops were planted in a timely fashion. The maturity of surveyed fields was typical for most of the respective counties, with most fields in the dent stage, some at dough, and only a few in the northern tier in the milk stage. All the surveyed fields in the southeastern corner of the state were in the dent stage, which could signal an early harvest for that portion of the state.
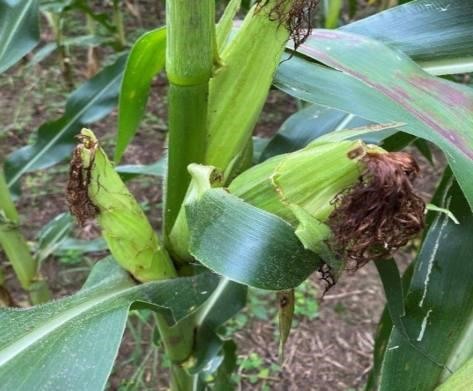
Favorable conditions resulted in two or three ears in some fields this year.
Overall, the corn crop looks to be good in most places. Farmers in the central part of the state that saw drought last year will hopefully be pleased with this year’s crop, and those in the Southeast may have one of their better years. However, the state is not without its usual amount of variability. Slug damage was particularly troublesome this spring, and some stands suffered with poor population and evenness of emergence. Another issue noted this year was a high amount of variability within a field. Kernel rows, row length, and kernel size varied widely from one spot in a field to another, which can make estimating yield challenging. Alternately, there were many places with multiple ears per stalk, which may positively affect yield in some fields.
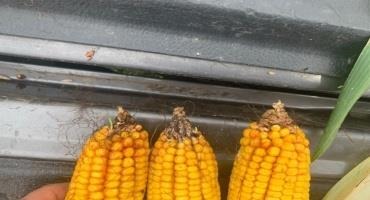
Molds are beginning to develop in some fields across the state, as with this one in Elk County and spouting kernels were also noted across the state.
The overall disease and insect pressure was relatively low for 2021. Northern corn leaf blight and gray leaf spot was noted in many fields, although not at excessive levels for most. However, what may be a larger problem are moldy ears, with some fields having exposed tips and mold starting to form. Additionally, sprouting in ear tips was also observed at a few fields across the state. Insect pressure was relatively light, with some tip feeding noted at select fields. Armyworm was present in the northern tier, with one field likely showing a yield loss. Additional issues from the year include poor nitrogen fertility and loss of herbicide residual activity in the northern tier, likely from the heavy rains earlier in the season.
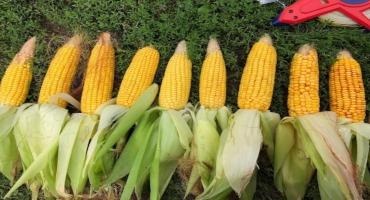
Higher-than-average variability within a field was noted by educators this year. One can see differences in kernel size, number of kernel rows, and row length from this field in Elk County.
Yield estimates and opinions of overall crop condition varied from county to county. In northern PA, yield estimates of surveyed fields ranged from 130 to over 200 bu./ac. with an average of 164, much higher than last year (Table 1). In the central and south-central parts of the state, estimates of yields ranged from 125 to 225 bu./ac., with an average of 163, up from last year. In the west, yield estimates of surveyed fields fell into the 145 to 205 bu./ac. range, with an average around 173. In the southeast, estimates of yields ranged from 160 to 245 bu./ac., with an average of surveyed fields at 206. Based on all fields surveyed, the average yield was approximately 177 bushels per acre, up nearly 25 bushels from last year, and close to our 2018 estimate. Historical numbers from the crop tour have captured up and down trends well relative to the year-end USDA estimates, while estimated yields have been higher than the USDA numbers. The USDA National Agricultural Statistics Service (NASS) estimated 2020 corn yields at 153 bu./ac., down from 2019's estimate of 168. It is likely that our estimates are again a bit high, as in nearly all regions we sampled the yields of the lowest yielding fields were much higher than the last few years. This could be reflective of good conditions and management for 2021, or low yielding fields were just not captured, thus bringing up the overall estimates.
Table 1. Corn yield estimates across regions of Pennsylvania.
| Region | 2021 Yield
Range (bu./ac.) | 2020 Yield
Range (bu./ac.) | 2021 Average
Yield (bu./ac.) | 2020 Average
Yield (bu./ac.) |
|---|
| West | 148 - 205 | 89 -207 | 173 | 146 |
| Northern Tier | 131 - 209 | 83 – 216 | 164 | 124 |
| Central | 123 - 226 | 52 – 232 | 163 | 140 |
| Southeast | 160 - 244 | 133 – 255 | 207 | 182 |
Promising soybeans
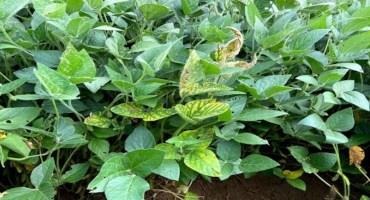
While we saw the usual amount of variability in our corn crop across the state, soybean condition seemed to be better overall and more consistent. Crop and pod development and overall crop stress was relatively low. Most planting dates were in late April and into May and most fields were between beginning seed (R5) and full seed (R6), which is slightly behind last year’s tour where more fields were at beginning maturity (R7). Lodging was noted in only 2 sample sites. However, an oddity this year was the presence of more one and two bean pods than usual and misshapen pods were present in some fields in Lebanon County.
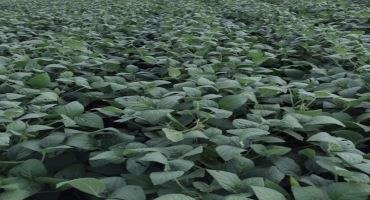
Overall soybean conditions were above average. Most fields showed promise in pod numbers and had relatively low pest pressure.
Soybean insect and disease pressure was consistent with most years. Frogeye leaf spot was present as usual, as was Septoria brown spot. White mold was found in fields and was particularly prevalent in Centre and Lancaster Counties. Sudden death syndrome and brown steam rot were also notable in a few fields across the state. The most prevalent insect pests found this year include aphids, Japanese beetles, and stinkbugs, although in most fields damage was not excessive.
In addition to white mold, sudden death syndrome / brown stem rot was prevalent in fields across the state.
In 2020, we moved to a simple estimate of pods per acre, as direct estimates of yield have been inconsistent. However, estimates of pods per acre still allow us to compare regions within the state as well as differences from year to year. Pod counts mostly reflect our good overall conditions this year, with all regions showing more pods per acre than last year (Table 2). Visual assessments from educators confirm the pod data, with all fields rated at average to well above average and none rated below average. Assessment of stand conditions reflects those counts, with most fields rated as ‘average'. For 2020, the USDA estimated a statewide average of 46 bushels per acre, down from 2019. With above average conditions, we expect yields to be more in-line with 2019 numbers.
Table 2: Soybean pod estimates and condition assessments for the respective regions across Pennsylvania.
| Region | 2021 Pods/acre | 2020 Pods/acre | 2021 Condition |
|---|
| West | 4,800,000 | 4,300,000 | Above average |
| Northern Tier | 4,600,000 | 3,200,000 | Above average |
| Central | 5,300,000 | 4,300,000 | Above average |
| Southeast | 5,800,000 | 5,500,000 | Above average |
Almost There
The 2021 corn and soybean crop is all but made for much of the state. Now all that is needed are consistent drying conditions and avoiding an early frost. Though this season looks promising in terms of crop yield and condition, this spotty weather that made for extremely dry conditions for some were harder to capture, so statewide average may not reflect local conditions. As farmers across the state begin to harvest corn and soybeans, we will be quite interested in what some of those numbers really are. We hope for everybody that things are as good as what we saw and that no late-season issues diminish the state’s corn and soybean crops.
Despite the challenges of ample rainfall and flooding last week, the 2021 Pennsylvania Crop Conditions Tour was a great success, thanks to the efforts of the state’s Agronomy Educators. Yet again they had to take on the task alone and they provided great insights, photos, and stories of the 2021 corn and soybean crop. Those that helped with this year’s tour include:
- Adrianna Murillo-Williams
- Andrew Frankenfield
- Brittany Clark
- Del Voight
- Dwane Miller
- Jeff Graybill
- Joey Akins
- Justin Brackenrich
- Leanna Duppstadt
- Liz Bosak
- Mason Tate
- Nicole Santangelo
Source : psu.edu