Since the 2018 farm bill, the price for Class I milk, i.e., milk used to produce beverage milk products, has been calculated using the simple average of advanced Class III (cheese) and Class IV (milk powders) skim milk prices plus 74 cents. In years prior, the formula was the higher of advanced Class III and Class IV skim milk prices. The change was made at the request of dairy industry stakeholders and was intended to improve risk management opportunities for beverage milk. COVID-19-induced volatility combined with the 2018 farm bill formula change resulted in hundreds of millions of dollars in Class I pool revenue losses, renewing industry discussions on optimal Class I pricing methods. Dairy farmers are curious about how the multiple circulating proposals of Class I formula options differ and how they would each impact Class I revenues. Today’s Market Intel analyzes three alternatives to the current Class I pricing calculation and their associated revenue impacts for dairy farmers supplying the Class I marketplace.
Policy background on the initial 2018 change and an analysis of early 2020 revenue impacts of the change were discussed previously here: Impact of the Farm Bill Change to the Class I Milk Price on Dairy Farm Income. Other analyses on the financial impacts of milk and dairy commodity price volatility on producer price differentials, de-pooling and the ineffectiveness of dairy risk management tools to offset negative PPDs can be viewed in the following: De-Pooling and Record-Large Negative PPDs Continue Into July, Negative PPDs to Offset Milk Price Rally, Revisiting Record-Large Negative PPDs on Milk Checks and Lack of DMC Payments Does Not Reflect Dairy Farmers’ Difficulties.
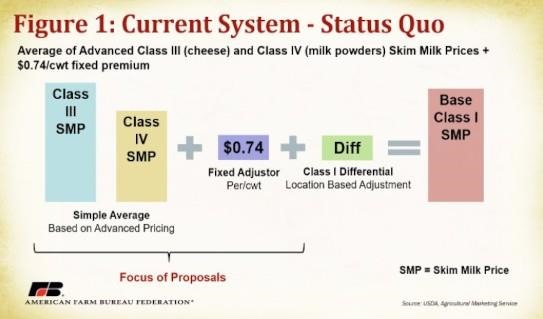
Understanding the structure of the current Class I pricing formula is essential to comparing alternatives. Figure I displays a diagram of the current calculation which, again, is the simple average of advanced Class III (cheese) and Class IV (milk powders) skim milk prices plus 74 cents. Any large disparity between the Class III skim milk price (SMP) and Class IV SMP is smoothed through the averaging feature, meaning the final Class I base calculation will not fully reflect the higher (or lower) option. The 74 cents was originally calculated using the historical difference between the Class III and IV skim prices to make dairy farmers and milk prices indifferent to the change over the long-term. The Class I location-based differential is included in our diagrams to reflect a final adjustment made for regional supply and demand differences, which currently range from $1.60 per hundredweight to $6.00 per hundredweight. Circulating Class I proposals focus on the first part of the equation, with a particular emphasis on the 74-cent adjustor.
Returning to the Higher-of
One of the major contenders for amending the Class I pricing formula is going back to the higher-of, which was used prior to the 2018 farm bill. Figure 2 displays the higher-of equation, which simply selects the higher price between Class III SMP and Class IV SMP. In the diagram example, the Class III SMP is higher and would be selected as the basis for the Class I SMP. The formula does not include a counterpart to the 74-cent adjustor of the current system and is often considered the easiest of the proposals to understand. It remains based on advanced prices which are calculated using values from the first two weeks of the preceding month.
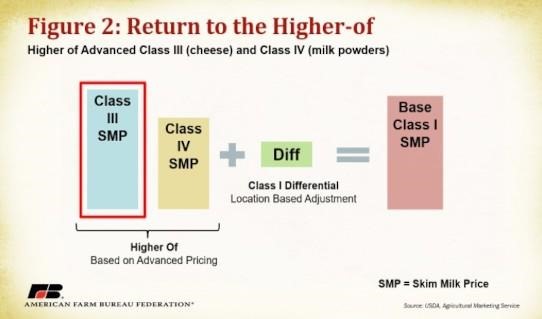
Figure 3 displays a comparison of Class I prices between the current formula and the higher-of option (if it was in place) from January 2018 to present, all else held constant. During 2020, following government intervention in cheese markets and co-op level supply reduction programs, cheese prices sharply rose while milk powder prices only increased marginally. Under a higher-of alternative, producers would have been able to reap the benefits of record Class III prices since the formula would have been directly linked to the higher option and not subject to smoothing effects of a simple average. That said, if the Class III and IV SMP prices are close in value, the 74-cent adjustment component of the current method may result in a higher Class III SMP than the higher-of option. This is common prior to the onset of COVID market forces.
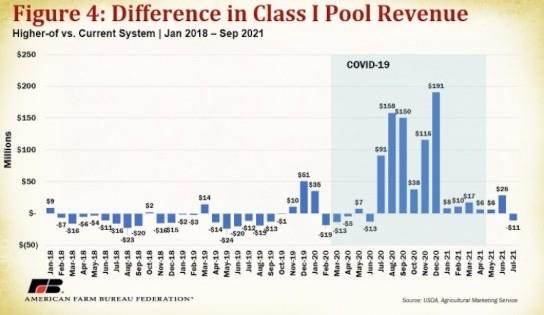
To estimate the impact on dairy farmer revenue, the difference in the Class I milk price between the current system and higher-of was multiplied by the Class I pool volume across all FMMOs. These calculations are presented in Figure 4. Between January 2018 and February 2020 (pre-COVID) the higher-of option would have provided positive Class I revenue pool benefits only 23% of the time. After February 2020, however, the higher-of would have provided over $785 million in Class I pool revenue benefits over the current system. Combined, this results in a $645 million revenue benefit of the higher-of over the current system within this timeframe. Consideration of this option must include the understanding of COVID’s unique marketplace effects, which resulted in massive pricing spreads the current pricing system could not adjust for. Expectations for large pricing spreads in the future keeps the higher-of option attractive.
National Milk Producers Federation Option
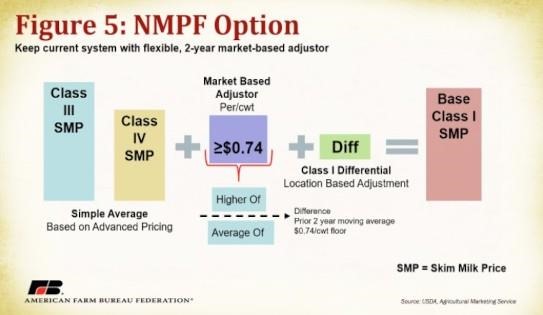
Another major contender for amending the Class I SMP pricing formula was designed by the National Milk Producers Federation (NMPF) on behalf of their member cooperatives. The option keeps the same general structure as the current system, including advanced pricing, but makes the 74-cent adjustor more market reactive. Instead of the 74 cents being fixed, the NMPF option would make 74 cents a floor and allow the adjustor to move above 74 cents. Using a calculation of the difference between the prior two-year (May-April) moving average of the higher-of and simple average of Class III SMP and Class IV SMP would determine whether the adjuster would rise above 74 cents. Based on this framework, the current 74-cent adjustor would rise to $1.63 for 2021-2023 to account for large price spreads during COVID-19.
Click here to see more...