By Carl Zulauf
Department of Agricultural, Environmental and Development Economics
Ohio State University
By Gary Schnitkey and Krista Swanson et.al
Department of Agricultural and Consumer Economics
University of Illinois
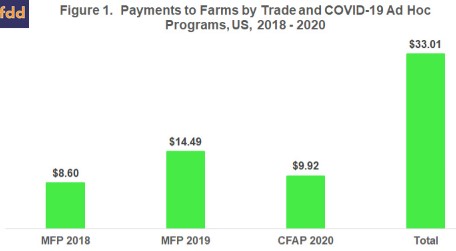
This article examines the distribution by commodity of the $33 billion in payments by the Market Facilitation Program (MFP) announced in 2018 (MFP 2018), MFP announced in 2019, and Coronavirus Food Assistance Program announced in 2020 (CFAP 2020) (see Figure 1). Soybeans dominate, accounting for 45% of all payments, perhaps signaling a need to change the safety net for soybeans. Collectively, 2018 farm bill covered program commodities account for 79% of all payments, but the share going to non-covered commodities has increased with each program. This article extends our discussion of ad hoc farm payments in the farmdoc daily article of July 29, 2020.
Background
MFP and CFAP payments are related to a disruption in demand, not farm production. MFP specifically addresses economic damage from lower exports due to retaliatory tariffs placed on US farm exports by other countries in response to tariffs the US imposed on their exports to the US. CFAP addresses economic damage attributed to the COVID-19 pandemic. MFP and CFAP payments are considered ad hoc because they (a) are not from the existing farm safety net and (b) cover current or past, not future, years. Data sources are the American Farm Bureau Federation for MFP 2018 and US Department of Agriculture (USDA), Farmers.gov for MFP 2019 and CFAP 2020.
Payment by Individual Commodity
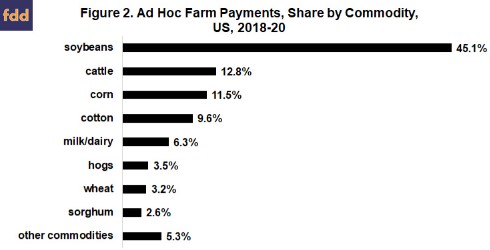
Soybeans have received 45% of all payments by the 3 programs, the largest share of any commodity by far (see Figure 2 and Data Note 1). Cattle, corn, cotton (almost all to upland cotton) and milk/dairy complete the top 5, accounting collectively for 40% of all payments.
Program vs. Non-Program Commodities
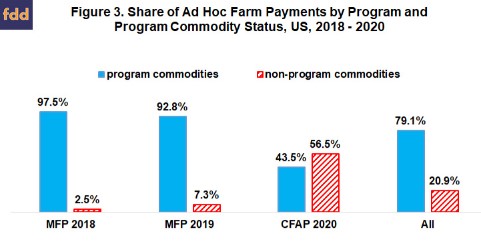
Program commodities in the 2018 farm bill account for 79% of MFP plus CFAP payments (see Figure 3 and Data Note 2). However, the share going to non-program commodities more than tripled between MFP 2018 and 2019, then more than septupled (7 times) from MFP 2019 to CFAP 2020 (see Figure 3). Number of non-program commodities grew similarly (see Data Note 3). Among non-program commodities, cattle and hogs account for the highest share of payments (see Figure 2). Collectively, fruits and vegetables account for over 3%.
If expressed relative to cash receipts, CFAP 2020 payments are higher for program commodities than for non-program commodities: 2.9% vs. 2.4%. Cash receipts of program and non-program commodities averaged approximately $148 and $229 billion, respectively, over the 2018 – 2020 calendar years (USDA, Economic Research Service) (see Data Note 4)
Concluding Observations
Ad hoc payments by MFP and CFAP have addressed disruptions in demand for farm commodities. Historically, assistance for demand disruptions are associated more with commodity than insurance programs, suggesting commodity programs will likely receive more attention in the next farm bill.
While not discussed in this paper, farms have been eligible for ad hoc assistance for weather damage to crop plantings and yields in the same years as MFP and CFAP, for example the WHIP+ program (farmdoc daily April 21, 2020). Ad hoc assistance is much more common for weather damage than for demand disruptions. Nevertheless, provision of this assistance in recent years raises the possibility that adequacy of crop insurance could be an issue in the next farm bill.
Approximately four-fifths of ad hoc payments by MFP and CFAP have gone to program commodities, suggesting policy makers view current commodity programs as not calibrated to provide adequate assistance against the disruptions in demand that prompted the ad hoc payments. Issues likely include both the level of assistance and its timing, specifically its late arrival.
Payments to soybeans stand out, suggesting its commodity program parameters are particularly viewed as inadequate. This suggestion is supported by the analysis discussed in the farmdoc daily article of July 8, 2020.
Share of spending on non-program commodities and its increase since MFP 2018 suggest extension of support to more farm commodities will likely be an issue in the next farm bill. This potential issue was also discussed in the farmdoc daily article of August 19, 2020.
Data Notes
- Payments by MFP2019 are available only by non-specialty crop, livestock, and specialty crop categories: Payments to individual non-specialty crops are estimated as follows: (1) quantity produced of a crop in 2019 is multiplied by the MFP 2019 payment rate per unit of output, (2) dollar values from step 1 are summed for all non-specialty crops, (3) a share is calculated for each non-specialty crop by dividing the calculated value in step 1 by the calculated value in step 2, and (4) step 3 shares are multiplied by MFP 2019 payments to non-specialty crops. For livestock products (hogs and milk); payments are estimated as follows: (1) estimates of trade damage reported by USDA, Office of the Chief Economist are summed for hogs and milk, (2) share of total livestock trade damage is calculated for hogs and milk, and (3) step 2 shares are multiplied by MFP 2019 payments to livestock. MFP 2019 payments to specialty crops are used as reported.
- Covered program commodities are barley, canola, corn, crambe, upland cotton, dried beans, dry peas, flaxseed, lentils, milk, mustard seed, oats, peanuts, rapeseed, long grain rice, medium and short grain rice, temperate japonica rice, safflower, sesame seed, small and large chickpeas, sorghum, soybeans, sunflower seed, and wheat.
- Non-program commodities by program are: MFP 2018 – hogs, fresh sweet cherries, and shelled almonds; MFP 2019 – alfalfa hay, almonds, cranberries, cultivated ginseng, fresh grapes, fresh sweet cherries, hazelnuts, hogs, macadamia nuts, millet, pecans, pistachios, rye, triticale, and walnuts; and CFAP 2020 – cattle, hogs, millet, sheep, and wool, plus at least 89 specialty crops.
- Cash receipts for 2020 are from the February, not September, 2020 forecast. The earlier forecast is used because it is probably more representative of underlying, longer term cash receipts.
Source : illinois.edu