From PSU Extension
Results of monitoring THI, rumination, and milk production on a Southeastern Pennsylvania farm.
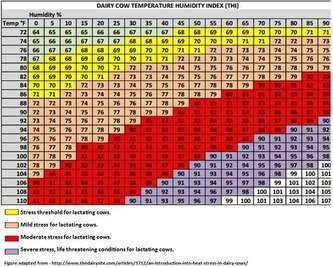
Temperature Humidity Index (THI) combines air temperature and relative humidity to calculate an index value to better represent the environmental conditions a cow or other animal feels. Dairy cows begin to experience heat stress when THI exceeds 68 (Figure 1). When cows experience heat stress, behavioral (decreased feed intake, increased standing time) and physiological (increased respiration, decreased rumination) changes occur in an attempt to mitigate the stress. Even low levels of heat stress can negatively impact milk production and reproductive performance in dairy cows. As heat stress levels increase, the impacts on cow performance and health become more extreme. The effect of THI on rumination and milk production were looked at on a dairy farm in Southeastern Pennsylvania; the results are presented below.
Case Farm and Data Collection
An average of 104 lactating Holstein cows were housed in a tunnel ventilated tie-stall barn. Over the past 12 months, cows averaged 92.4 pounds of milk per day with 3.8% fat and 3.0% protein based on DHIA data. Rumination data was collected using a Heatime HR Stanchion Barn activity system (SCR by Allflex). Temperature Humidity Index (THI) was calculated from temperature and humidity sensors located in the barn and integrated with the activity system software. Daily milk production was calculated from every other day bulk tank milk weights; bulk tank weights were divided by 104 cows and two days of milk in the bulk tank per pick-up. Rumination, THI, and milk production data were collected from July 7 through October 15, 2016.
Case Farm Results
During the course of the study, maximum daily THI ranged from 60 to 85, minimum daily THI ranged from 46 to 75, and average daily rumination ranged from 311 to 497 minutes per day (Figure 2). In general dairy cows will spend about 8 hours (480 minutes) per day ruminating. Cattle experienced at least some level of heat stress every day from July 7 through September 24. Through the end of September and even into October there were days when the THI passed the level that cattle experience heat stress. The impact of heat stress on rumination is clearly shown in Figure 2, especially for a period in mid-August when even the minimum THI value for the day remained above the heat stress threshold. Regression analysis of rumination versus THI showed that for every one point increase in maximum daily THI, dairy cows spent a little over 6 minutes less time ruminating each day (Figure 3). This one-point increase in maximum daily THI also resulted in a 0.6-pound decrease in milk production per cow per day (Figure 4).
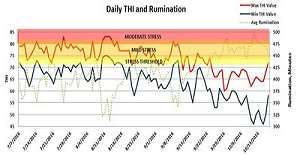
Figure 2. Temperature Humidity Index (THI) and rumination of dairy cows in a Southeastern Pennsylvania herd from July 7 through October 15, 2016.
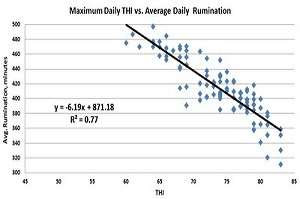
Figure 2. Temperature Humidity Index (THI) and rumination of dairy cows in a Southeastern Pennsylvania herd from July 7 through October 15, 2016.

Figure 4. Regression of maximum daily Temperature Humidity Index (THI) and average daily milk production of cows in a Southeastern Pennsylvania herd from July 7 through October 15, 2016.
This article has focused on the use of rumination sensors and weather station data to demonstrate the effects of heat stress in dairy cattle. However, the more important thing to take away is that all the data presented in this paper were collected with technologies that are commercially available to dairy farmers today. These and other precision dairy technologies offer a wide range of detailed information that impact productivity, efficiency, and profitability on the dairy farm. In the current case farm example, the dairy farmer knows the impact of heat stress on his cows in his facilities, allowing him to make a more informed decision about potential heat abatement methods. Producers, nutritionists, veterinarians, and other consultants within the dairy industry could make better use of the data already being generated on farms by existing technologies and should be prepared to take advantage of new technologies as they become available.
Source: psu.edu