By Carl Zulauf
Department of Agricultural, Environmental and Development Economics
Ohio State University
Gary Schnitkey and Krista Swanson et.al
Department of Agricultural and Consumer Economics
University of Illinois
USDA, FSA (US Department of Agriculture, Farm Service Agency) has released 2019 crop year payments by the ARC (Agriculture Risk Coverage) and PLC (Price Loss Coverage) commodity programs. Together with crop insurance, they form the basic crop safety net. ARC and PLC payments in a year that also had large ad hoc payments to covered program commodities may become a framing perspective during the discussion over the anticipated 2023 reauthorization of the farm bill.
Commodity Program Payments in Perspective
ARC and PLC made $6.2 billion in commodity program payments to the 23 covered commodities for the 2019 crop year (see Figure 1 and Data Note 1). This was 22% of the $27.8 billion in Federal payments to covered commodities by commodity programs, crop insurance (net of farm-paid premiums), and ad hoc MFP (Market Facilitation Program) and CFAP (Coronavirus Food Assistance Program) (see Data Notes 2 and 3). Farms also received payments from other Federal ad hoc programs, such as PPP (Payroll Protection Program), QLA (Quality Loss Assistance), and WHIP+ (Wildfire and Hurricane Indemnity Program plus). Some of these payments went to farms that plant covered commodities.
Payments by Covered Commodity
Wheat received 28% of total ARC plus PLC payments, with corn a close second at 25% (see Figure 2). Seed cotton and soybeans also had double digit shares. These 4 covered commodities accounted for 80% of all 2019 commodity program payments.
Program Payment Share by Covered Commodity
Eighty percent of all 2019 commodity program payments were made by PLC. It made no payment to crambe, mustard, oats, rice–TJ (temperate Japonica rice), sesame, and soybeans, but at least 95% of commodity payments to the other covered commodities excluding safflower (49%), corn (70%), and sunflowers (81%) (see Figure 3).
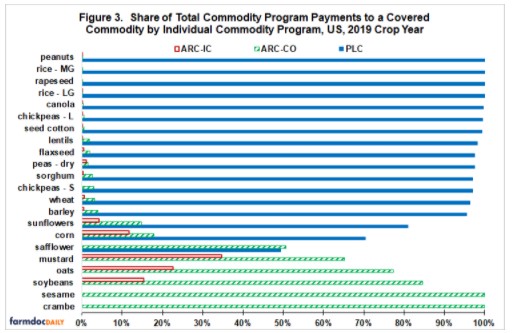
ARC-CO (ARC county version) made payments to all covered commodities excluding rice-TJ. It made the majority of commodity program payments to crambe, sesame, soybeans, oats, mustard, and safflower (see Figure 3). In total, ARC-CO made 15% of all 2019 commodity program payments.
Share of payments by ARC-IC (ARC individual farm version) was highest for mustard (35%), oats (23%), soybeans (15%), and corn (12%) (see Figure 3). In total, ARC-IC made 5% of all 2019 commodity program payments. During the 2014 Farm Bill, its highest share of all commodity program payments was 1.2% for the 2017 crop year. ARC-IC’s 2019 payments were larger because farmers knew before sign up ended if they had prevent plant acres and low yields. They also knew more about price than usual. This knowledge allowed them to estimate payments by the 3 programs with greater than usual accuracy. Usually little is known about yield and price for the upcoming crop year during sign up. In the usual situation, farms rarely choose ARC-IC because it pays on 65% of base acres while ARC-CO and PLC pay on 85% of base acres. In essence, for 2019 farms could determine if ARC-IC would likely pay enough to more than offset its 20 percentage point lower payment acres.
Total Commodity Program Payment per Base Acre
Total commodity program payment per base acre ranged from $0 for rice-TJ to $163 for peanuts (see Figure 4). Rice-MG was the only other covered commodity with over a $100 payment per base acre. Payment per base acre averaged $24 across all covered commodities. Only 7 covered commodities did not have a double digit base acre payment: rice-TJ, oats, and 5 “other oilseeds” ? sesame, mustard, safflower, crambe, and sunflowers. Even with the inclusion of a reference price escalator in the 2018 Farm Bill, base acre payment continued to vary widely among “other oilseeds” as canola averaged $62 per base acre. For additional discussion of the reference price escalator, see the farmdoc daily article of February 21, 2019.
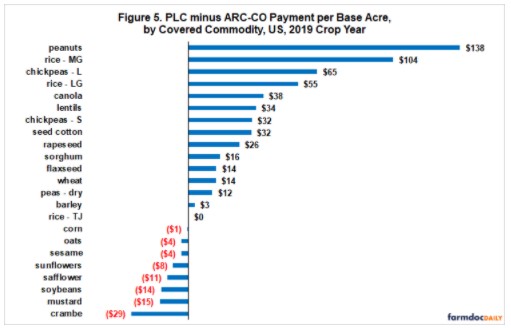
ARC-CO vs. PLC
As the 2 commodity programs most often elected, it is useful to compare ARC-CO and PLC payments per base acre. ARC-CO paid more per base acre to 8 covered commodities; PLC paid more to 14 covered commodities (see Figure 5). ARC-CO’s payment advantage per base acre ranged from $1 (corn) to $29 (crambe). PLC’s advantage ranged from $3 (barley) to $138 (peanuts).
Both research and anecdotal evidence suggest farmers choose the program they expect to pay the most per base acre. Given this perspective, an interesting policy question is, “Did farmers as a group chose the highest paying program for a covered commodity?” This aggregate question is assessed because Information is not available to assess whether individual farms made the “correct” choice.
Excluding soybeans, farms elected PLC over ARC-CO. Only 14% of soybean base acres were in PLC. Otherwise, PLC’s smallest share of base acres was 61% (oats). Farms had a higher share of base acres in the program that paid more for 15, or 68%, of the 22 covered commodities that made a payment. In addition, 64% of total ARC-CO plus PLC base acres were in the program that paid more. If corn is excluded, the share goes to 90% of base acres. ARC-CO and PLC made essentially the same base acre payment to corn. When interpreting these measures of “correct” decisions, it is important to remember that farmers knew their 2019 acres and yield and had nontrivial information on the 2019 market year average price by the time sign up ended. Hence, the success rate should be higher for 2019 than the usual year when sign up ends before most covered commodities are planted.
Concluding Observations
ARC and PLC paid $6.2 billion for the 2019 crop year. More broadly, basic farm safety net payments from commodity programs and crop insurance were substantially less than ad hoc payments by MFP and CFAP.
The large ad hoc payments on top of sizable basic farm safety net payments prompts serious policy questions. Were the large 2019 ad hoc payments to covered commodities an aberration that will have no lasting impact on farm policy? Or, do they signal that the US body politic believes the current farm safety net is inadequate or inappropriate? If the last question is answered yes, how should the basic farm safety net be changed? In contemplating such changes, it is important to note that the ad hoc payments addressed disruptions which largely occurred outside the growing season period covered by crop insurance. Thus, these policy questions primarily apply to commodity programs unless Congress would decide to consider extending the period covered by crop insurance.
A policy question prompted by this dashboard is, “Did the large variation across covered commodities in commodity program payment per base acre play a role in large ad hoc payments?” A farmdoc daily article of July 8, 2020 found that the soybean reference price was low relative to several benchmarks, suggesting that the lack of PLC payments by soybeans may have played a role in MFP payments.
Large ad hoc payments were also made to a diverse array of animal and crop non-covered commodities. These payments raise the issue of whether the farm safety net should be expanded. If so, an important policy question becomes, “Will expansion impact current covered commodities?” See the farmdoc daily articles of July 29 and August 19, 2019 for discussion of this potential policy question.
Data Notes
(1) Covered program commodities under the 2018 Farm Bill are barley, canola, corn, crambe, dried beans, dry peas, flaxseed, lentils, mustard seed, oats, peanuts, rapeseed, long grain rice, medium and short grain rice, temperate japonica rice, safflower, seed cotton, sesame seed, small and large chickpeas, sorghum, soybeans, sunflower seed, and wheat.
(2) MFP provided assistance for economic damage due to lower exports caused by retaliatory tariffs placed on US farm exports by other countries in response to tariffs the US imposed on their exports to the US. CFAP provided assistance for economic damage attributed to the COVID-19 pandemic.
(3). Payments by MFP-2019 are reported only as totals for non-specialty crop, livestock, and specialty crop categories: Payments to individual non-specialty crops are estimated as follows: (1) quantity produced of a crop in 2019 is multiplied by the MFP-2019 payment rate per unit of output, (2) dollar values from step 1 are summed for all non-specialty crops, (3) a share is calculated for each non-specialty crop by dividing the calculated value in step 1 by the calculated value in step 2, and (4) step 3 shares are multiplied by MFP-2019 payments to non-specialty crops as a group.
Source : illinois.edu