By Jeanine Bentley
After falling from 148.6 pounds in 2004 to 133.5 pounds in 2014, the per capita supply of red meat, poultry, and fish/shellfish available for Americans to eat after adjusting for losses rose to 143.9 pounds in 2017. Red meat (beef, pork, veal, and lamb) accounted for 51 percent of 2017’s 143.9-pound total, compared with 42 percent for poultry (chicken and turkey) and 7 percent for fish and shellfish.
ERS calculates per capita loss-adjusted food availability in a given year by taking per capita supplies of food available for human consumption and adjusting for some of the spoilage, plate waste, and other losses in grocery stores, restaurants, and homes to more closely approximate consumption. Over 2015-17, beef had the largest percentage increase in per capita loss-adjusted availability—growing by 6 percent. ERS commodity analysts point to higher demand for red meat as one of the drivers of this increase. Recovering consumer incomes after the 2007-09 recession and stable or declining retail red meat prices have increased U.S. consumers’ demand for red meat in recent years.
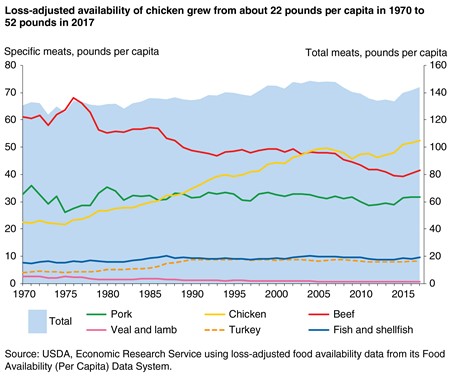
Historical data reveal different trends for different meats and seafood. Loss-adjusted availability of beef reached a high of 67.9 pounds per capita in 1976, but trended downward to 39.3 pounds in 2015 before increasing to 41.6 pounds in 2017. Loss-adjusted availability of pork displays a relatively flat trend over the last three decades, ranging from 28.8 to 33.5 pounds per capita. Veal and lamb loss-adjusted availability is down from 2.7 pounds per capita in 1970 to less than a pound in 2017.
Loss-adjusted availability of fish and shellfish was 7.5 pounds per capita in 1970, grew during the 1970s and 1980s, and has averaged 9.4 pounds per capita since 2000. Within the fish and shellfish category, shellfish (crustaceans, mollusks, squid, and other shellfish) had the greatest increase—more than doubling from 1.3 pounds per capita in 1970 to 3.2 pounds per capita in 2017.
Overall, chicken and turkey had the largest gains over the last five decades. Loss-adjusted chicken availability increased from 22.4 pounds per capita in 1970 to 52.3 pounds per capita in 2017. For turkey, loss-adjusted availability doubled from 4.0 pounds per capita in 1970 to 8.2 pounds in 1989, and has remained between 8 and 9 pounds per capita since 1990. Efficiencies in chicken and turkey production have led to lower bird mortality rates and a higher average weight per bird, expanding supplies and keeping prices in check. The lower retail price for chicken and turkey compared to beef and pork may have contributed to poultry’s continued popularity. Another demand boost may have been the poultry industry’s development and marketing of convenient grocery store offerings, such as skinless, boneless breasts and ready-to-eat rotisserie chickens. Poultry consumption may have also benefited from health-related concerns: on a per-ounce basis, chicken has less total fat, saturated fat, and cholesterol than beef.
Source : USDA