Overview
Corn, soybeans, and wheat were down; cotton was up for the week.
Last Friday, USDA released limited details on a support package to agricultural producers -- the Coronavirus Food Assistance Program (CFAP). Direct assistance to producers will be $16 billion ($9.6 billion to the livestock industry and dairy, $3.9 billion for row crop producers, $2.1 billion for specialty crops, and $500 million for other crops). According to details released by Senator Hoeven of North Dakota, producers will receive a payment determined using two calculations: 1) 85% of the price losses that occurred January 1-April 15, 2020; and 2) 30% of the expected losses from April 15 through the next two quarters. Payment limits of $125,000 per commodity and $250,000 per individual or entity will apply. Program details and implementation rules are still being worked on by USDA. Additional details should be available by early May with payments hopefully making it to producer bank accounts by the end of May or early June.
Numerous details need to be clarified, but three important questions for row crop producers are: What production is eligible? What prices will be used for both the realized and projected price losses? and Will additional funding be made available should a funding short fall for the CFAP occur?
For example, the March Grain Stocks report indicated that as of March 1, 7.953 billion bushels of corn were held in storage in the US, 4.454 billion on farm. 2.253 billion bushels of soybeans were held in storage with 1.012 billion held on farm. Nearby futures prices from the beginning of January to April 15th dropped approximately $1.25 for soybeans and $0.75 for corn. So a rough estimate of losses are $2.84 billion ($0.75 x 85% x 4.454 billion bushels of on farm corn) for corn and $1.08 billion ($1.25 x 85% x 1.012 billion bushels of on farm soybeans). That is $3.92 billion in lost value for two commodities. Obviously this is an over simplification used for illustrative purposes and does not account for payment limits, price series used, ineligible production etc., however, it does call into question whether the amount of money will be sufficient to cover the specified losses across commodities.
Unfortunately at this time there are more questions than answers and everyone will have to wait for more details from the USDA. However, in the meantime, producers are strongly encouraged to organize inventory and pricing records to make sure they can act when USDA releases CFAP program details.
| Previous | Current | Change |
USD Index | 99.82 | 100.52 | 0.70 |
Crude Oil | 25.13 | 17.24 | -7.89 |
DJIA | 24,234 | 23,689 | -545 |
Corn
Ethanol production for the week ending April 17 was 0.563 million barrels per day, down 7,000 barrels from the previous week. Ethanol stocks were 27.689 million barrels, up 0.220 million barrels compare to last week. Corn net sales reported by exporters for April 10-16 were down compared to last week with net sales of 28.6 million bushels for the 2019/20 marketing year and 2.2 million bushels for the 2020/21 marketing year. Exports for the same time period were down 32% from last week at 32.7 million bushels. Corn export sales and commitments were 81% of the USDA estimated total exports for the 2019/20 marketing year (September 1 to August 31) compared to the previous 5-year average of 86%. Across Tennessee, average corn basis (cash price-nearby futures price) weakened or remained unchanged at Memphis, Northwest Barge Points, Northwest, and Upper-middle Tennessee. Overall, basis for the week ranged from 15 under to 26 over, with an average of 5 over the May futures at elevators and barge points. May 2020 corn futures closed at $3.15, down 7 cents since last Friday. For the week, May 2020 corn futures traded between $3.01 and $3.23. May/Jul and May/Dec future spreads were 8 and 21 cents. July 2020 corn futures closed at $3.23, down 6 cents since last Friday.
Corn | May 20 | Change | Dec 20 | Change |
Price | $3.15 | -$0.07 | $3.36 | -$0.07 |
Support | $3.10 | -$0.04 | $3.31 | -$0.07 |
Resistance | $3.27 | $0.02 | $3.46 | $0.01 |
20 Day MA | $3.27 | -$0.07 | $3.46 | -$0.08 |
50 Day MA | $3.51 | -$0.07 | $3.64 | -$0.06 |
100 Day MA | $3.70 | -$0.04 | $3.81 | -$0.02 |
4-Week High | $3.52 | -$0.04 | $3.69 | -$0.01 |
4-Week Low | $3.01 | -$0.16 | $3.25 | -$0.15 |
Technical Trend | Strong Down | = | Strong Down | = |
Nationally the Crop Progress report estimated corn planting at 7% compared to 3% last week, 5% last year, and a 5-year average of 9%. In Tennessee, the Crop Progress report estimated corn planted at 23% compared to 12% last week, 22% last year, and a 5-year average of 25%; and corn emerged at 3% compared to 7% last year and a 5-year average of 4%. In Tennessee, new crop cash corn contracts ranged from $3.08 to $3.36. December 2020 corn futures closed at $3.36, down 7 cents since last Friday. Downside price protection could be obtained by purchasing a $3.40 December 2020 Put Option costing 26 cents establishing a $3.14 futures floor.
Soybeans
Net sales reported by exporters were up compared to last week with net sales of 12.7 million bushels for the 2019/20 marketing year and 0.02 million bushels for the 2020/21 marketing year. Exports for the same period were up 1% compared to last week at 19.4 million bushels. Soybean export sales and commitments were 79% of the USDA estimated total annual exports for the 2019/20 marketing year (September 1 to August 31), compared to the previous 5-year average of 95%. Average soybean basis weakened at Memphis, Northwest Barge Points, Northwest, and Upper-middle Tennessee. Basis ranged from 19 under to 28 over the May futures contract at elevators and barge points. Average basis at the end of the week was 11 over the May futures contract. May 2020 soybean futures closed at $8.32, unchanged since last Friday. For the week, May 2020 soybean futures traded between $8.08 and $8.48. May/Jul and May/Nov future spreads were 7 and 9 cents. July 2020 soybean futures closed at $8.39, down 3 cents since last Friday. May soybean-to-corn price ratio was 2.64 at the end of the week.
Soybeans | May 20 | Change | Nov 20 | Change |
Price | $8.32 | $0.00 | $8.41 | -$0.10 |
Support | $8.25 | -$0.03 | $8.28 | -$0.19 |
Resistance | $8.55 | $0.04 | $8.58 | -$0.10 |
20 Day MA | $8.51 | -$0.12 | $8.61 | -$0.06 |
50 Day MA | $8.68 | -$0.07 | $8.80 | -$0.07 |
100 Day MA | $8.99 | -$0.04 | $9.14 | -$0.05 |
4-Week High | $8.97 | $0.00 | $8.87 | $0.00 |
4-Week Low | $8.08 | -$0.14 | $8.31 | -$0.05 |
Technical Trend | Strong Down | = | Strong Down | = |
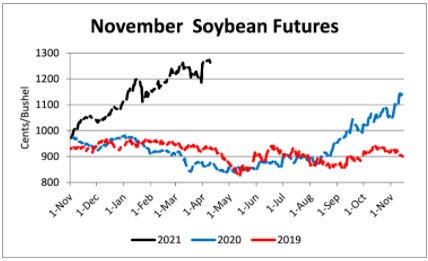
Nationally the Crop Progress report estimated soybean planting at 2% compared to 1% last year, and a 5-year average of 1%. In Tennessee, the Crop Progress report estimated soybeans planted at 2% compared to 1% last year, and a 5-year average of 1%. In Tennessee, new crop soybean cash contracts ranged from $8.10 to $8.70. Nov/Dec 2020 soybean-to-corn price ratio was 2.50 at the end of the week. November 2020 soybean futures closed at $8.41, down 10 cents since last Friday. Downside price protection could be achieved by purchasing an $8.60 November 2020 Put Option which would cost 51 cents and set an $8.09 futures floor.
Cotton
Net sales reported by exporters were up compared to last week with net sales of 15,700 bales for the 2019/20 marketing year and 46,400 bales for the 2020/21 marketing year. Exports for the same time period were down 15% compared to last week at 266,200 bales. Upland cotton export sales were 109% of the USDA estimated total annual exports for the 2019/20 marketing year (August 1 to July 31), compared to the previous 5-year average of 99%. Delta upland cotton spot price quotes for April 23 were 53.12 cents/lb (41-4-34) and 55.37 cents/lb (31-3-35). Adjusted World Price (AWP) increased 0.47 cents to 45.25 cents. May 2020 cotton futures closed at 54.93 cents, up 2.16 cents since last Friday. For the week, May 2020 cotton futures traded between 52 and 57.95 cents. May/Jul and May/Dec cotton futures spreads were 0.7 cents and 2.74 cents. July 2020 cotton futures closed at 55.63 cents, up 2.77 cents since last Friday.
Cotton | May 20 | Change | Dec 20 | Change |
Price | 54.93 | 2.16 | 57.67 | 2.41 |
Support | 53.42 | 1.47 | 56.44 | 1.84 |
Resistance | 57.36 | 3.19 | 58.98 | 2.72 |
20 Day MA | 52.79 | 0.53 | 54.73 | 0.64 |
50 Day MA | 58.12 | -1.35 | 59.46 | -0.63 |
100 Day MA | 63.70 | -0.58 | 64.65 | -0.52 |
4-Week High | 57.95 | -0.64 | 58.85 | -0.69 |
4-Week Low | 48.35 | 0.00 | 50.18 | 0.00 |
Technical Trend | Down | = | Down | = |
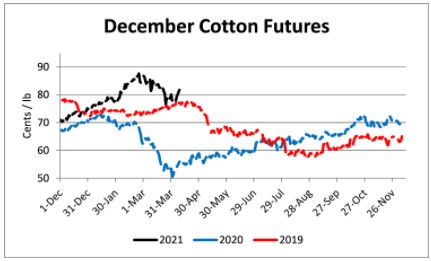
Nationally, the Crop Progress report estimated cotton planted at 11%, compared to 9% last week, 8% last year, and a 5-year average of 9%. December 2020 cotton futures closed at 57.67, up 2.41 cents since last Friday. Downside price protection could be obtained by purchasing a 58 cent December 2020 Put Option costing 4.67 cents establishing a 53.33 cent futures floor.
Wheat
Wheat net sales reported by exporters were down compared to last week with net sales of 9.0 million bushels for the 2019/20 marketing year and 5.7 million bushels for the 2020/21 marketing year. Exports for the same time period were down 25% from last week at 19.9 million bushels. Wheat export sales were 95% of the USDA estimated total annual exports for the 2019/20 marketing year (June 1 to May 31), compared to the previous 5-year average of 104%. May 2020 wheat futures closed at $5.26, down 7 cents since last Friday. May 2020 wheat futures traded between $5.26 and $5.62 this week. May wheat-to-corn price ratio was 1.67. May/Jul and May/Sep future spreads were 4 and 7 cents.
Wheat | May 20 | Change | Jul 20 | Change |
Price | $5.26 | -$0.07 | $5.30 | -$0.03 |
Support | $5.09 | -$0.08 | $5.15 | -$0.04 |
Resistance | $5.59 | $0.08 | $5.56 | $0.07 |
20 Day MA | $5.49 | -$0.05 | $4.46 | -$1.03 |
50 Day MA | $5.39 | -$0.01 | $5.38 | -$0.01 |
100 Day MA | $5.46 | $0.00 | $5.46 | $0.00 |
4-Week High | $5.87 | $0.00 | $5.71 | $0.00 |
4-Week Low | $5.24 | $0.30 | $5.25 | $0.30 |
Technical Trend | Down | = | Down | = |
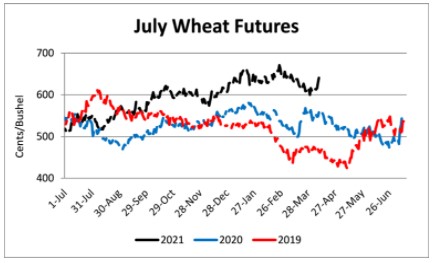
Nationally the Crop Progress report estimated winter wheat condition at 57% good-to-excellent and 13% poor-to-very poor; winter wheat headed at 14% compared to 6% last week, 8% last year, and a 5-year average of 15%; and spring wheat planted at 7% compared to 5% last week, 4% last year, and a 5-year average of 18%. In Tennessee, winter wheat condition was estimated at 64% good-to-excellent and 3% poor-to-very poor; winter wheat jointing at 87% compared to 73% last week, 84% last year, and a 5-year average of 80%; and winter wheat headed at 26% compared to 6% last week, 16% last year, and a 5-year average of 16%. In Tennessee, June/July 2020 cash contracts ranged from $5.24 to $5.71. July 2020 wheat futures closed at $5.30, down 3 cents since last Friday. Downside price protection could be obtained by purchasing a $5.35 July 2020 Put Option costing 28 cents establishing a $5.07 futures floor. July wheat-to-corn price ratio was 1.64. September 2020 wheat futures closed at $5.33, down 5 cents since last Friday.
Source : tennessee.edu