Overview
Corn, cotton, soybeans, and wheat were up for the week.
This week markets were influenced by the USDA August WASDE report and a derecho that created a path of destruction from Eastern Nebraska through Iowa and into Wisconsin and Illinois.
The August WASDE report indicated record national corn and soybean yields of 181.8 bu/acre and 53.3 bu/acre. In Tennessee, yields were estimated at 178 bu/acre for corn, up 1 bu/acre from last year, and 49 bu/acre for soybeans, up 2 bu/acre compared to last year. Due to record yields and minor changes in use, U.S. corn stocks were projected to end the 2020/21 marketing year at 2.756 billion bushels up 528 million compared to the previous marketing year. Soybean ending stocks were projected slightly lower year-over-year at 610 million bushels down 5 million bushels from the previous year. U.S cotton production was projected at 18.08 million bales and ending stocks at 7.6 million bales. U.S wheat stocks were projected down 119 million bushels year-over-year at 925 million bushels. Overall, the WASDE report indicated abundant U.S. supplies for all four major row crops.
The derecho that carved a path through several Corn Belt states is estimated to have damaged 5-10 million acres of crops creating production uncertainty for parts of Iowa and Illinois. It is likely that soybeans will recover more easily than corn, however at this point in time production losses remain uncertain. The derecho also potentially destroyed a substantial amount of grain storage. This could have basis repercussions if storage capacity cannot be restored before harvest or alternatives (bags, piles etc) developed. Lost production was not factored into the WASDE report.
This week the USDA extended the deadline for producers to apply for CFAP direct payments to producers. The new deadline is September 11, 2020. Those producers with unpriced corn, soybeans, and cotton as of January 15, 2020 should contact their FSA office or visit https://www.farmers.gov/cfap to apply.
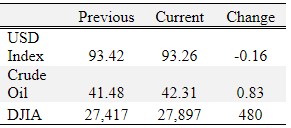
This week’s numbers are as at close of markets Thursday.
Corn
Ethanol production for the week ending August 7 was 0.918 million barrels per day, down 13,000 barrels from the previous week. Ethanol stocks were 19.750 million barrels, down 0.596 million barrels compared to last week. Corn net sales reported by exporters for July 31 to August 6 were down compared to last week with net sales of 14.8 million bushels for the 2019/20 marketing year and 21.8 million bushels for the 2020/21 marketing year. Exports for the same time period were up 95% from last week at 52.5 million bushels. Corn export sales and commitments were 97% of the USDA estimated total exports for the 2019/20 marketing year (September 1 to August 31) compared to the previous 5-year average of 103%. Across Tennessee, average corn basis (cash price-nearby futures price) weakened at Northwest and North-Central and strengthened or remained unchanged at Mississippi River, West-Central, and West elevators and barge point. Overall, basis for the week ranged from 7 under to 15 over, with an average of 6 over the September futures. September 2020 corn futures closed at $3.25, up 18 cents since last Friday. For the week, September 2020 corn futures traded between $3.07 and $3.27. Sep/Dec and Sep/Mar future spreads were 13 and 24 cents.
Corn | Sep 20 | Change | Dec 20 | Change |
Price | $3.25 | $0.18 | $3.38 | $0.18 |
Support | $3.09 | $0.05 | $3.22 | $0.05 |
Resistance | $3.35 | $0.22 | $3.48 | $0.23 |
20 Day MA | $3.18 | -$0.03 | $3.29 | -$0.01 |
50 Day MA | $3.28 | -$0.01 | $3.37 | -$0.01 |
100 Day MA | $3.30 | -$0.01 | $3.39 | -$0.01 |
4-Week High | $3.34 | -$0.21 | $3.41 | -$0.21 |
4-Week Low | $3.07 | $0.00 | $3.20 | $0.00 |
Technical Trend | Down | = | Down | = |
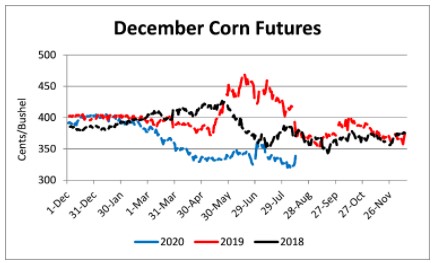
Nationally the Crop Progress report estimated corn condition at 71% good-to-excellent and 8% poor-to-very poor; corn silking at 97% compared to 92% last week, 87% last year, and a 5-year average of 95%; corn dough at 59% compared to 39% last week, 34% last year, and a 5-year average of 52%; and corn dented at 11% compared to 6% last year and a 5-year average of 12%. In Tennessee, the Crop Progress report estimated corn condition at 71% good-to-excellent and 6% poor-to-very poor; corn silking at 98% compared to 94% last week, 98% last year, and a 5-year average of 99%; corn dough at 70% compared to 59% last week, 86% last year, and a 5-year average of 88%; and corn dented at 11% compared to 38% last year and a 5-year average of 41%. In Tennessee, new crop cash corn contracts ranged from $2.98 to $3.49. December 2020 corn futures closed at $3.38, up 18 cents since last Friday. Downside price protection could be obtained by purchasing a $3.40 December 2020 Put Option costing 14 cents establishing a $3.26 futures floor. March 2021 corn futures closed at $3.49, up 17 cents since last Friday.
Soybeans
Net sales reported by exporters were up compared to last week with net sales of 20.9 million bushels for the 2019/20 marketing year and 104.3 million bushels for the 2020/21 marketing year. Exports for the same period were up 36% compared to last week at 40.6 million bushels. Soybean export sales and commitments were 106% of the USDA estimated total annual exports for the 2019/20 marketing year (September 1 to August 31), compared to the previous 5-year average of 104%. Across Tennessee, average soybean basis strengthened at Northwest, North-Central, West-Central, West, and Mississippi River elevators and barge points. Basis ranged from 2 over to 34 over the September futures contract. Average basis at the end of the week was 20 over the September futures contract. September 2020 soybean futures closed at $8.96, up 31 cents since last Friday. For the week, September 2020 soybean futures traded between $8.63 and $8.99. Sep/Nov and Sep/Jan future spreads were 3 and 8 cents. September soybean-to-corn price ratio was 2.76 at the end of the week.
Soybeans | Sep 20 | Change | Nov 20 | Change |
Price | $8.96 | $0.31 | $8.99 | $0.32 |
Support | $8.73 | $0.16 | $8.75 | $0.17 |
Resistance | $9.10 | $0.31 | $9.14 | $0.30 |
20 Day MA | $8.86 | $0.00 | $8.88 | $0.00 |
50 Day MA | $8.80 | $0.03 | $8.84 | $0.02 |
100 Day MA | $8.66 | $0.01 | $8.70 | $0.01 |
4-Week High | $9.04 | $0.00 | $9.03 | -$0.06 |
4-Week Low | $8.63 | -$0.01 | $8.65 | -$0.01 |
Technical Trend | Down | = | Down | = |
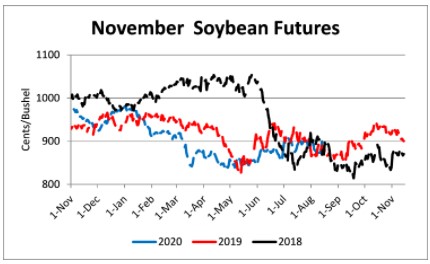
Nationally the Crop Progress report estimated soybean condition at 74% good-to-excellent and 5% poor-to-very poor; soybeans blooming at 92% compared to 85% last week, 79% last year, and a 5-year average of 89%; and soybeans setting pods at 75% compared to 59% last week, 49% last year, and a 5-year average of 68%. In Tennessee, soybean condition was estimated at 69% good-to-excellent and 7% poor-to-very poor; soybeans blooming at 84% compared to 73% last week, 83% last year, and a 5-year average of 87%; and soybeans setting pods at 58% compared to 45% last week, 63% last year, and a 5-year average of 68%. In Tennessee, new crop soybean cash contracts ranged from $8.62 to $9.33. Nov/Dec 2020 soybean-to-corn price ratio was 2.66 at the end of the week. November 2020 soybean futures closed at $8.99, up 32 cents since last Friday. Downside price protection could be achieved by purchasing a $9.00 November 2020 Put Option which would cost 20 cents and set an $8.80 futures floor. January 2021 soybean futures closed at $9.04, up 30 cents since last Friday.
Cotton
Net sales reported by exporters were down compared to last week with net sales of 6,900 bales for the 2020/21 marketing year. Exports for the same time period were down 7% compared to last week at 322,200 bales. A total of 2,883,200 running bale sales were carried over from 2019/20 to 2020/21 marketing year. Accumulated exports for the 2019/20 marketing year were 14,174,500, up 8% compared to the previous marketing year. Upland cotton export sales were 47% of the USDA estimated total annual exports for the 2020/21 marketing year (August 1 to July 31), compared to the previous 5-year average of 43%. Delta upland cotton spot price quotes for August 13 were 58.43 cents/lb (41-4-34) and 60.68 cents/lb (31-3-35). Adjusted World Price (AWP) decreased 0.52 cents to 48.92 cents.
Cotton | Dec 20 | Change | Mar 21 | Change |
Price | 62.99 | 0.63 | 63.92 | 0.73 |
Support | 61.62 | 1.21 | 62.73 | 1.50 |
Resistance | 64.16 | -1.69 | 64.95 | -1.58 |
20 Day MA | 62.65 | 0.04 | 63.38 | 0.08 |
50 Day MA | 61.65 | 0.32 | 62.33 | 0.34 |
100 Day MA | 59.04 | 0.29 | 59.85 | 0.28 |
4-Week High | 65.05 | 0.00 | 65.70 | 0.00 |
4-Week Low | 59.51 | 0.00 | 60.26 | 0.00 |
Technical Trend | Up | = | Up | = |
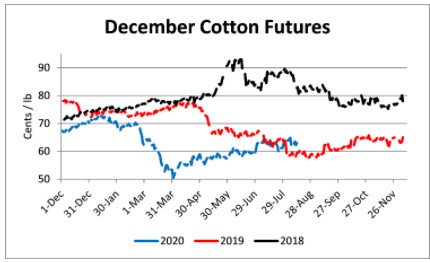
Nationally, the Crop Progress report estimated cotton condition at 42% good-to-excellent and 23% poor-to-very poor; cotton squaring at 96% compared to 91% last week, 97% last year, and a 5-year average of 96%; cotton setting bolls at 71% compared to 54% last week, 72% last year, and a 5-year average of 70%; and cotton bolls opening at 9% compared to 17% last year and a 5-year average of 11%. In Tennessee, cotton condition was estimated at 63% good-to-excellent and 19% poor-to-very poor; cotton squaring at 94% compared to 90% last week, 99% last year, and a 5-year average of 98%; and cotton setting bolls at 79% compared to 67% last week, 76% last year, and a 5-year average of 82%. December 2020 cotton futures closed at 62.99, up 0.63 cents since last Friday. For the week, December 2020 cotton futures traded between 62.01 and 63.95 cents. Dec/Mar and Dec/Dec cotton futures spreads were 0.93 cent and 0.87 cent. Downside price protection could be obtained by purchasing a 63 cent December 2020 Put Option costing 2.8 cents establishing a 60.2 cent futures floor. March 2021 cotton futures closed at 63.92 cents, up 0.73 cents since last Friday. December 2021 cotton futures closed at 63.86 cents, up 1.16 cents since last Friday.
Wheat
Wheat net sales reported by exporters were down compared to last week with net sales of 13.5 million bushels for the 2020/21 marketing year. Exports for the same time period were down 22% from last week at 17.2 million bushels. Wheat export sales were 40% of the USDA estimated total annual exports for the 2020/21 marketing year (June 1 to May 31), compared to the previous 5-year average of 41%.
Wheat | Sep 20 | Change | Jul 21 | Change |
Price | $4.96 | $0.01 | $5.23 | $0.02 |
Support | $4.83 | $0.00 | $5.11 | $0.01 |
Resistance | $5.07 | -$0.02 | $5.32 | $0.00 |
20 Day MA | $5.17 | -$0.08 | $5.35 | -$0.05 |
50 Day MA | $5.10 | -$0.02 | $5.29 | -$0.02 |
100 Day MA | $5.21 | -$0.02 | $5.35 | $0.00 |
4-Week High | $5.51 | $0.00 | $5.54 | $0.00 |
4-Week Low | $4.88 | -$0.02 | $5.14 | $0.00 |
Technical Trend | Down | = | Down | = |
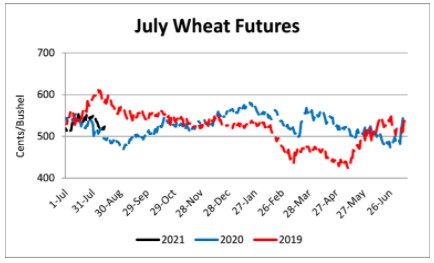
Nationally the Crop Progress report estimated winter wheat harvested at 90% compared to 85% last week, 87% last year, and a 5-year average of 93%; spring wheat condition at 69% good-to-excellent and 7% poor-to-very poor; and spring wheat harvested at 15% compared to 5% last week, 6% last year, and a 5-year average of 25%. In Tennessee, August 2020 wheat cash contracts ranged from $5.00 to $5.12. September 2020 wheat futures closed at $4.96, up 1 cent since last Friday. September 2020 wheat futures traded between $4.88 and $5.00 this week. September wheat-to-corn price ratio was 1.53. Sep/Dec and Sep/Jul future spreads were 10 and 27 cents. December 2020 wheat futures closed at $5.06, up 3 cents since last Friday. December wheat-to-corn price ratio was 1.50. July 2021 wheat futures closed at $5.23, up 2 cents since last Friday. Downside price protection could be obtained by purchasing a $5.40 July 2021 Put Option costing 41 cents establishing a $4.99 futures floor.
Source : tennessee.edu