By Gary Schnitkey and Krista Swanson et.al
Department of Agricultural and Consumer Economics
University of Illinois
By Carl Zulauf
Department of Agricultural, Environmental and Development Economics
Ohio State University
For 2022, planting decisions relative to corn and soybeans are likely more complicated than usual due to rising production costs and uncertainties about commodity and fertilizer prices. Higher priced nitrogen fertilizer, used more heavily on corn acres, will require corn prices to be higher relative to soybean prices than historically. Current fall 2022 bids of $5.00 for corn and $12.00 per bushel for soybeans cause the relative profitability of corn and soybeans to be about equal in northern and central Illinois. In contrast, soybeans are projected more profitable than corn in southern Illinois. Budgeting prices of $4.50 for corn and $12.00 for soybeans cause soybeans to be more profitable than corn across Illinois. Changes in nitrogen, corn, and soybean prices between now and spring will alter projections of relative profitability, thereby likely influencing 2022 planting decisions.
Cost Increases
Production costs will increase in 2022. Both corn and soybean non-land costs are projected to be the highest since 2000, the year in which comparable cost data began to be prepared. Current 2022 estimates of non-land costs for high-productivity farmland in central Illinois are $677 per acre for corn and $413 per acre for soybeans (see Figure 1). The $677 per acre estimate for corn is $70 higher than the $607 cost for 2021. The $413 estimate for soybeans is $42 per acre higher than the $371 cost for 2020.
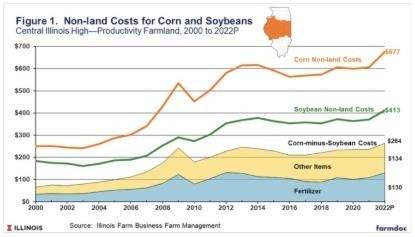
In all previous years, corn costs are higher than soybean costs. Corn profitability relative to soybean profitability is impacted by the difference between corn and soybean costs, with larger differences favoring soybeans. Corn-minus-soybean costs are projected at $264 per acre in 2022 (264 = $677 corn non-land costs – $412 soybean non-land costs), the largest difference since 2000. The previous largest difference was $244 per acre in 2009. The 2022 estimate exceeds the 2009 values by $20 per acre. The 2022 estimate is $28 per acre higher than the 2021 difference of $236 per acre.
From 2000 to 2021, differences in fertilizer costs account for 48% of the difference in corn-minus-soybean expenses. The 2022 estimate is 49%. Most of this difference is because nitrogen fertilizer is used on corn acres and generally is not used, or used at a low rate, on soybean acres. Changes in phosphate and potash prices — two other major fertilizer nutrients — are used more proportionally across corn and soybean acres. As a result, changes in nitrogen fertilizer prices have the most significant effect on the relative profitability of corn and soybeans.
Nitrogen Prices
In recent months, nitrogen prices have significantly increased. Anhydrous ammonia is a substantial source of nitrogen fertilizer, and is the feedstock for urea and nitrogen solutions, other major nitrogen fertilizers (see farmdoc daily, February 17, 2021). As a result, nitrogen fertilizer prices are highly correlated with anhydrous ammonia prices. According to the Agricultural Marketing Service (AMS) — an agency of the U.S. Department of Agriculture — anhydrous ammonia prices reached $857 per acre in October 2021, well above the August price of $749 per ton (see Figure 2). Ammonia prices in October 2020 averaged $434 per ton, 50% below the current $857 per ton price.
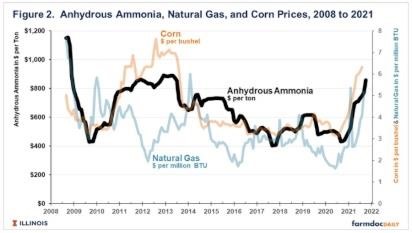
Two factors are highly related to anhydrous ammonia prices. The first is natural gas prices. Natural gas is a major input into anhydrous ammonia. As natural gas prices increase, so do the costs of producing anhydrous ammonia and vice versa. Besides showing anhydrous ammonia price, Figure 2 shows the price of natural gas at the Henry Hub. Over time, anhydrous ammonia and natural gas prices have a .43 correlation coefficient.
Anhydrous ammonia prices are more positively correlated with corn prices. Figure 2 also shows the monthly national corn price as reported by the National Agriculture Statistics Service. From 2008 to 2021, monthly anhydrous ammonia and corn prices have a .74 correlation coefficient.
Both corn and natural gas prices have increased, indicating that fertilizer prices likely will increase. Moreover, energy markets face a great deal of uncertainty at this point. The U.S. Energy Information Agency (EIA) forecasts that natural gas will remain at heightened levels through January, when downward pressure may emerge (see https://www.eia.gov/outlooks/steo/). As always, winter weather and a host of other factors will impact energy demand. As a result, natural gas and nitrogen prices remain uncertain going into spring, possibly changing prices from current levels.
Impacts on Corn and Soybean Profitability
Changing fertilizer prices from now to spring will impact corn and soybeans’ relative profitability and break-even corn and soybean prices. Table 1 illustrates these factors by showing corn and soybean budgets for Northern (Panel A), Central, and Southern Illinois (Panel D). Central Illinois is further broken down into high-productivity (Panel B) and low-productivity farmland (Panel C). Each panel contains a regional budget with yield and costs from the August 2021 version of the budgets (see farmdoc daily, July 27, 2021).
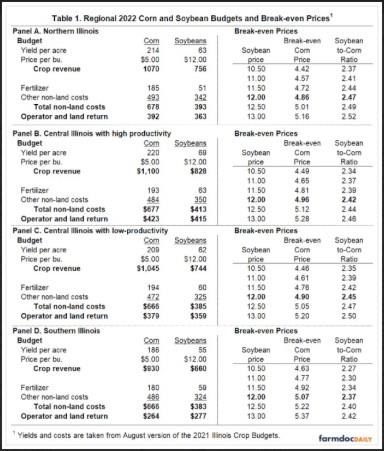
To illustrate, take the central Illinois high-productivity budget in panel B. Yields are 220 bushels per acre for corn and 69 bushels per acre for soybeans. Fertilizer costs are $193 per acre for corn and $63 per acre for soybeans. Changes in nitrogen prices will impact the $193 fertilizer cost for corn. Other non-land costs are $484 per acre for corn and $350 for soybeans, giving total non-land costs of $677 for corn and $413 for soybeans. Operator and land return is $423 for corn and $415 per acre for soybeans, meaning that corn is projected to be $8 per acre more profitable than soybeans. These projections are made at a $5.00 per bushel corn price and a $12.00 per bushel soybean price, current bids for fall delivery.
Changes in corn and soybean prices will impact profitability, and break-even prices also are shown in Table 1. For high-productivity farmland in central Illinois, a $4.96 corn price causes corn to have the same profitability as soybeans given a $12.00 per bushel soybean price (see break-even prices in Panel B). This results in a soybean-to-corn ratio of 2.42 (2.42 = $12.00 soybean price / $4.96 corn price).
Note that break-even corn prices vary across the regions for a $12.00 soybean price. The break-even corn price is $4.86 in northern Illinois (see Panel A), lower than $4.96 for central Illinois high productivity. Farmers in northern Illinois typically plant more corn acres relative to soybeans, and the lower break-even corn price suggests that economics may warrant that practice. The break-even corn price is $5.07 in southern Illinois, above the central Illinois break-even. Southern Illinois farmers plant more soybeans than corn.
Also, note that soybean-to-corn ratios increase with soybean prices. For high-productivity farmland in central Illinois, the soybean-to-corn ratio is 2.34 for a $10.50 soybean price, 2.42 for a $12 soybean price, and 2.46 for a $13 soybean price. Soybean-to-corn ratios are often used to imply the relative profitability of corn and soybeans. While containing useful information, the soybean-to-corn ratio is an imperfect indicator of the relative profitability of corn and soybeans, with the break-even level varying with levels of yield, prices, and costs.
Currently, fall bids in central Illinois are near $5.00 for corn and $12.00 for soybeans, causing corn and soybeans to have roughly the same profitability. Earlies budgeted prices of $4.50 for corn and $12.00 for soybeans resulted in a projection for soybeans more profitable than corn across all regions of Illinois.
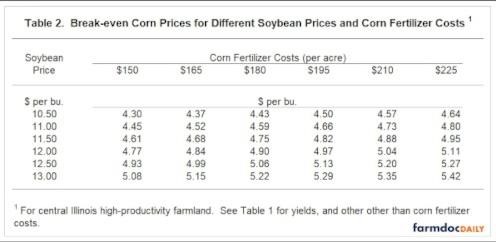
Changes in nitrogen prices will impact break-even levels, as shown in Table 2. Table 2 gives break-even corn prices for different fertilizer costs and soybean prices. As nitrogen fertilizer prices increase, corn prices must increase relative to the soybean price for corn and soybean to have the same relative profitability.
Summary
Uncertainty about nitrogen fertilizer prices moving into spring will make it difficult to determine whether corn or soybeans is more projected to be profitable for 2022. Given the higher relative costs for corn, corn prices will need to be relatively higher than soybean prices for corn to have the same profitability as in recent years.
Source : illinois.edu