By Mark Mauldin
In the past few weeks I’ve been to couple of bull sales and visited with numerous buyers. These interactions have reminded me that there is still a great deal of uncertainty among perspective buyers about how to effectively use expected progeny differnces (EPDs), and other performance data when selecting bulls. For the sake of time I will not rehash all the basic principles of using EPDs (there are several publications linked at the end of the article that will cover that), but I will address a key concept that came up frequently in my recent conversations – effectively using EPDs is all about making sure you consider the values in the proper context.
EPDs are meant for comparison (bulls are compared based on the spread between their respective values for a trait, not on the actual values), so unless you compare EPDs of differnt animals frequently, it can be somewhat difficult to maintain a feel for what “good” or “bad” numbers really look like. In other words, when comparing two bulls’ EPD values you only know which of the two is better or worse. They may both be outstanding, or they could both be inferior. Only when the EPD values are seen in the context of the entire breed can you truly get a feel for “good” or “bad”. Breed associations publish percentile breakdowns to show how individual bulls compare to the rest of the breed in each EPD category. The breakdowns are updated at least yearly, as the values associated with each percentile change due to genetic improvement of the breed (new sires), and additional data collection (fine tuning the EPD values for established sires).

Figure 1. An EPD Comarison of two bulls to the breed as a whole.
Figure 1 shows EPD values for two bulls, and an abbreviated breed percentile breakdown. Because you have the percentile breakdown, you can determine that in relation to the breed, Lot 1 excels in calving ease direct (CED). He is in the top 25% of the breed. While Lot 2 is somewhat below average in CED, and is in the top 75% of the breed. Conversely, we can determine that Lot 2 excels in weaning weight (WW); he is in the top 10% of the breed, while Lot 1 is more in the middle of the pack (average) for that trait. You could make these kinds of observations for all the listed EPDs. Without the percentile breakdown, you have only determined the expected differences in future performance (4% difference in the number of unassisted births from cows bred to the two bulls and 10.3 pounds of expected difference in weaning weight of calves sired by the two bulls). While understanding the expected differences is important, understanding where the bulls fall within the breed for specific traits is equally, if not more, important. Sometimes it can be a bit of a challenge to find breed percentile breakdowns. To help with that, there are links to the percentile breakdowns of many popular breeds at the end of the article.
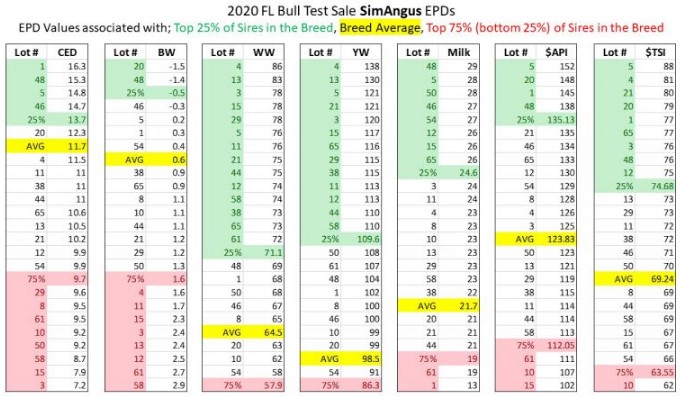
Figure 2. Example of a tool developed to help buyers at the Florida Bull Test Sale quickly and easily understand how the bulls in the sale compared to each other and the rest of the breed for various EPDs. A separate tool was developed for each breed.
Figure 2 is an example of a tool I developed for potential bull buyers at the recent Florida Bull Test Sale. Sale lots were ordered from “best” to “worst” for each available EPD independently. Then the 25th, 50th, and the 75th percentile values from the breed percentile breakdown were overlaid on the ordered lists. This can give buyers a way to quickly see how the bulls they were considering compared to the other bulls in the sale, and to the rest of the breed for each EPD. With a nominal investment of time and familiarity with spreadsheets, this strategy could be used for any sale catalog. Additionally, with some forethought, the final document could be tailored to maximize effectiveness by showing only EPDs that you deem to be economically significant, or by including more/different percentile indicators based on specific goals, etc. I appreciate that there is always more to do than we have time for, but taking steps like this to make your bull selection more effective will pay dividends in the long-run. If you have a sale catalog and would like help with the process of creating a tool like the one shown above, don’t hesitate to contact me; I would be happy to assist.
The numeric values associated with different EPDs are expressed in different units. Understanding what units are being expressed is another part of ensuring EPDs are evaluated in proper context. Some examples:
1) The values associated with Calving Ease Direct (CED) are used to express the expected difference in the percentage of unassisted births
2) The values associated with Birth Weight (BW), Weaning Weight (WW), Yearling Weight (YW), and Milk are expressed in pounds of calf
3) The values associated with Marbling (MARB) are expressed in fractions of USDA Marbling Score (a scale from 1-10.9)
4) The values associated with any of the economic selection indexes ($B, $W, $API, etc.) are expressed in dollars per head
Appreciating what units are used can help you make more practical decisions about what degree of variation in numeric value is acceptable. The same numeric difference can have very different implications depending on the units of the specific EPD. Consider this, in the Angus breed, a difference of 1 in the MARB EPD moves a bull from the 95th to the 10th percentile, or vise versa. While the same numeric difference in WW or YW moves the bull up or down one percentile at most. Bringing us, once again to the fact that EPDs need to be evaluated in relation to the percentile breakdown.
The predictive power of EPDs, and the ability they give producers to direct the genetic improvement of their cattle is amazing. Please don’t dismiss this opportunity simply because all the numbers can be a bit overwhelming. Start early, sale day is way too late. Figure out what you are looking for and how to effectively use all the available data to help you find it. Don’t be afraid to ask for help, whether it’s determining what traits are the most important to your operation, or helping you sort through and organize all the data, UF/IFAS Extension faculty are available to help you.
Source : ufl.edu