As a farmer, you possibly know that these are some quality grades determined by the U.S. Department of Agriculture (USDA) meat grading system. The USDA initiated the official grading due to commercial needs. At that time, it was necessary to establish ways to appraise the relative merit of meats and establish standards based on overall quality for trade practices and preferences.
Although the official grading and stamping system was established in 1927, in 1916, the USDA came up with tentative standards for beef carcass grades, which were intended to improve reports generated by the National Meat Market Reporting Service. After being reviewed, the standards were finally promulgated official on June 3, 1926. Standards were continuously revised and amended until the last version was published on July 1, 1996.
The USDA inspection for wholesomeness is mandatory and paid by public funds but grading and stamping is a voluntary service. Processors and producers may request grading services through the USDA’s Agricultural Marketing Service, which are performed by federal licensed graders at a rate that may vary from $84 to $114 per regular hour (rates from 2019).
Overall, grading separates beef carcasses into distinct uniform groups based on two major traits, quality and yield. Those are two different terms that provide information about eating experience and the amount of boneless edible lean meat that can be obtained from a carcass, respectively. Both quality and yield traits are essential tools that translate grades to value and overall desirability to retailers and consumers.
Quality grades
Quality traits are associated with expected tenderness, juiciness and flavor of beef. There is a total of eight quality grades: Prime, Choice, Select, Standard, Commercial, Utility, Cutter and Canner.
Quality grades are assessed by evaluating physiological maturity (A, B, C, D, E), marbling degree (from practically devoid to very abundant). Lean color and texture are also attributes that are taken in consideration and may vary from A = light cherry red and fine textured to E = dark red and coarse textured. Although most of the USDA inspected plants use dentition to identify and segregate cattle younger than 30 months, in theory, physiological age during grading is evaluated by determining the degree of ossification, which is usually assessed in the dorsal tip of the thoracic vertebrae.
Marbling is the amount of flecks of fat located in the lean meat (intramuscular fat) and is evaluated in the ribeye after the separation between the 12th and 13th ribs. There are 10 degrees of marbling that numerically vary from 000 to 999. Higher marbling degrees indicate higher grades, which are usually associated to better eating experience.
Yield grades
Yield grade estimates the expected cutability of the carcass, which is the lean meat obtained from closely trimmed, boneless retail cuts from the major primals (round, loin, rib and chuck). It ranges from 1 to 5, where yield grade 1 is the highest grade that indicates the greatest ratio of lean to fat and the grade 5 is the lowest ratio. In order to estimate yield grade (YG), an equation containing values of fat thickness; ribeye area; estimation of kidney, pelvic and heart fat (KPH%); and hot carcass weight must be used:
YG = 2.50 + (2.50 x fat thickness in inches) + (0.20 x KPH%) + (0.0038 x HCW in pounds) – (0.32 x ribeye area in square inches)
Fat thickness is measured over the ribeye around three-quarters of the length of the ribeye from its chine bone end.
Kidney, pelvic and heart fat (KPH%) corresponds to the total amount of fat internally found in regions adjacent to the kidneys, pelvis and heart. For research purposes, weighing carcasses before and after the removal of the fat in those areas provides better estimation, however in commercial settings, KPH is estimated subjectively by the grader. Commonly carcasses have 1 - 4 % KPH.
Hot carcass weight (HCW) is the weight of the carcasses after the removal of head, all internal organs located in the main cavities of the body (viscera), hide and part of the limbs (metacarpus and metatarsus). In order to obtain HCW, carcasses are weighed before entering the chilling process.
Ribeye area (REA) is also estimated between the 12th and 13th ribs. Due to processing speed in large operations, federal graders estimate the area subjectively. However, it is possible to precisely calculate REA by using a calibrated dot-grid (with squares of 0.1 square inches). The grid must be placed aligned to the long axis of the ribeye. Interior dots that are completely within the perimeter of the ribeye muscle and boundary dots which are on the perimeter of the ribeye must be counted. Both numbers must be input in the following mathematical (Pick’s) theorem:
REA (in square inches) = [interior dots + ( boundary dots/2 ) – 1] x 0.1
For example, for a 739 pound carcass, with 0.4 inches of fat thickness, 3% KPH, and a ribeye area with 93 interior dots and 22 boundary dots, calculations are:
REA (in square inches) = [106 + ( 22/2 ) – 1] x 0.1 = 11.6 square inches
YG = 2.50 + (2.50 x 0.4) + (0.20 x 3) + (0.0038 x 739) – (0.32 x 11.6) = 3.196
YG is approximately = 3
However, there is also a second method to rapidly estimate the yield grade by using a preliminary yield grade (PYG), which is estimated by the thickness of the back fat (Table 1).
Table 1: Prelimary Yield Grade as estimated by fat thickness
Click here to view Table 1 from UNR
Once the PYG is determined, adjustments based on carcass weight, REA and KPH% (Tables 2-4) are input in the following formula:
YG = (PYG based on backfat) + (adjustment for carcass weight) – (adjustment for ribeye area) – (adjustment for KPH)
Table 2: Carcass weight adjustments
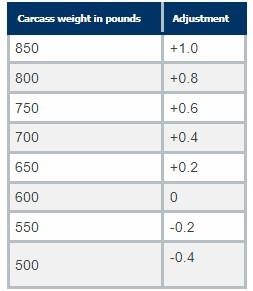
Click here to view Table 2 from UNR
Table 2: Ribeye area adjustments
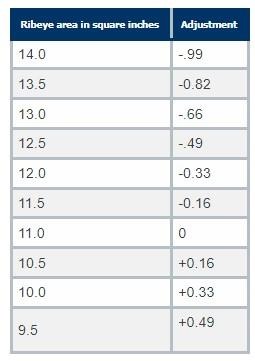
Click here to view Table 2 from UNR
Table 3: KPH adjustments
Click here to view Table 3 from UNR
For example, for a carcass with 0.4 inches of fat thickness, weighing 700 pounds, with REA of 11.5 square inches and 3% KPH, Yield grade calculated via shortcut method is approximately 4.
YG = (3) + (0.4) – (– 0.16) – (– 0.16) = 3.72.
YG is approximately = 4
Expected cutability by grade is shown in Table 4.
Table 4: Expected cutability by grade
Click here to view Table 4 from UNR
Harvesting and processing at Wolf Pack Meats
When harvesting and processing at Wolf Pack Meats, the University of Nevada, Reno's USDA-inspected processing facility, local farmers may request estimations of Quality and Yield grades for a small fee. Although the estimations are not official, they provide to farmers an idea of the quality standards of their livestock.
Source : unr.edu