By Bradley Zwilling
Illinois FBFM Association and Department of Agricultural and Consumer Economics
University of Illinois and
By Dale Lattz
Department of Agricultural and Consumer Economics
University of Illinois
In an earlier article (
farmdoc daily January 17, 2020), we examined working capital to value of farm production for selected producer characteristics. Working capital to value of farm production is one of the traditional measures of liquidity suggested by the Farm Financial Standards Council (FFSC), with others being current ratio and working capital. Another way to measure liquidity is working capital to operating expense. Overall, working capital to operating expense has declined since 2012.
Background
Using Illinois Farm Business Farm Management (FBFM) Association data, this article examines working capital to operating expenses for selected producer characteristics. While working capital to value of farm production is a good measure of liquidity that is widely used, it is also good to compare working capital to operating expenses. Operating expenses are all costs for the business minus interest, taxes, depreciation and amortization. Working capital to operating expense shows how much of the normal operating expenses can be covered if no revenue. The higher the figure, the more expenses can be covered and thus a stronger liquidity position.
Comparing Working Capital to Value of Farm Production and Working Capital to Operating Expenses
Figure 1 shows the trends over time of the average farm in the FBFM database for each of the two measurements of liquidity. As you can see, the two measures follow a similar trend over the last ten year period, however, working capital to operating expense is much more variable.
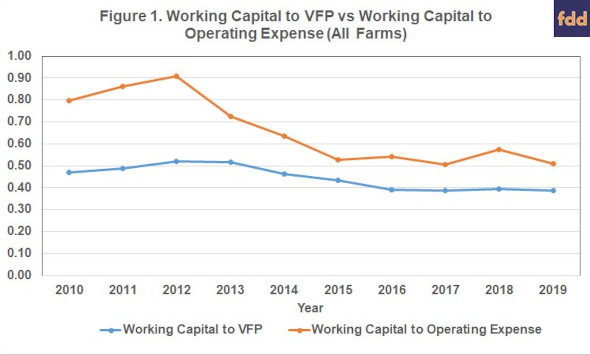
This variability is primarily due to the numerator in the calculation, or working capital. Working capital is current assets minus current liabilities. One main component of working capital is the end of year, or period, inventory. So as the inventory value increases with everything else constant, so will working capital. When dividing working capital by value of farm production and inventory value increases with everything else constant, then that ratio will stay the same because the change in inventory is part of the value of production. However, during the run up in prices and inventory values from 2010 to 2012, operating expenses were not moving as fast, thus the larger increase in working capital to operating expense measure. Since 2012, we have seen the two different measures of liquidity more closely aligned.
Working Capital to Operating Expense by Farm Type
Figure 2 charts the measurement of working capital to operating expense by farm type. The four farm types are hog, grain, dairy and beef farms based on FBFM’s definition of these farms. Grain farms are defined as farms where the value of feed fed was less than 40 percent of the crop returns. Hog, beef and dairy farms are defined as farms where the value of feed fed was more than 40 percent of crop returns and the livestock enterprise (hog, dairy or beef) received the majority of the value of feed fed.
Generally, working capital to operating expense has declined since 2012 for most farm types. The 2012-13 period was the end of the era of high grain prices. Since then, we have seen financial deterioration in most farms as farm incomes have declined.
Hog and beef farms seem to have more variability in this measure. This is explained by the fact that the variability of livestock prices has an effect on inventory values that come into play when calculating accrual farm incomes and working capital. The downward trend for beef farms is not as evident as other farm types due the large increase in cattle inventories with the run up prices in 2014 and 2015 as well as having the lowest operating expense among the different types of farms and operating expenses have varied the least year over year. Finally, dairy farms have a lower working capital to operating expense than the other three farm types. The majority of a dairy farm’s assets are in the dairy herd, an intermediate asset, and buildings, a long-term asset. Dairy farms also benefit from a monthly income stream in milk sales that allow them to survive on lower liquidity.
Working Capital to Operating Expense by Operator Age
Figure 3 charts the measurement of working capital to operating expense by the age of the operator. The groups are divided into five different age groups ranging from less than thirty years old to sixty years old and older.
Similar to working capital by farm types, all these measures of liquidity declined since 2012. For example, the ratio for the group of fifty to fifty-nine year olds peaked in 2013 at .87 and had dropped to .38 by 2019. That is a deterioration of about 56 percent.
On average, working capital is stronger for farmers that are in the “50 to 59” and over 60 age groups compared to younger farmers. Generally, older farmers are more established than younger farmers, leading to better financial strength.
Summary
Data from the Illinois Farm Business Farm Management Association is used to examine another measure of farm liquidity, working capital to operating expense. When comparing this other measure for all farms to working capital to value of farm production over the last ten years, working capital to operating expense is more variable, but generally follows the same trend. Data from 2010 to 2019 sorted by type of farm and by age of producer was used. Grain farms generally exhibited the strongest ten-year average ratio over this time with the least variability. Beef and hog farms were more variable. Regarding the age of the operator, generally the older the operator the stronger the ratio. Both groups showed declines in the strength during this time.
The authors would like to acknowledge that data used in this study comes from the Illinois Farm Business Farm Management (FBFM) Association. Without Illinois FBFM, information as comprehensive and accurate as this would not be available for educational purposes. FBFM, which consists of 5,500+ farmers and 68 professional field staff, is a not-for-profit organization available to all farm operators in Illinois. FBFM field staff provide on-farm counsel along with recordkeeping, farm financial management, business entity planning and income tax management.
Source : illinois.edu