By Carl Zulauf
Despite frequent headlines of burdensome grain & oilseed stocks, they are normal when measured appropriately. The important storyline is that stocks have not increased relative to use even though world yield of grains & oilseeds has been at or above trend since 2012. Stocks are not the reason prices and return are low. An intriguing hypothesis is that prices and returns are low because the current market is “priced to perfection,” where perfection means the market currently anticipates a lower-than-normal probability that world grain & oilseed yield in 2026 will fall below trend. If this hypothesis is correct, any shortfall in 2026 yield below trend in any of the world’s major production areas will likely send prices higher to ration supply across current demand momentum. The preceding does not mean prices and returns will be higher come 2026 harvest. If 2026 world yields exceed trend, even by a small margin, prices and returns will remain low.
Measuring Stocks Appropriately: Stock-Use Ratio
US corn stocks at the end of the 2025 crop year are currently estimated at 2.1 billion bushels. 2.1 billion bushels means one thing when use is 4.6 billion bushels, as it was in 1974. It means something else when use is 16.5 billion bushels, the current projection for 2025. 2.1 billion bushels is nearly half of 1974 US use of corn (domestic consumption plus exports). That would be burdensome by any measure. In 2025, 2.1 billion bushels is only 13% of US use. Stocks need to be measured relative to use.
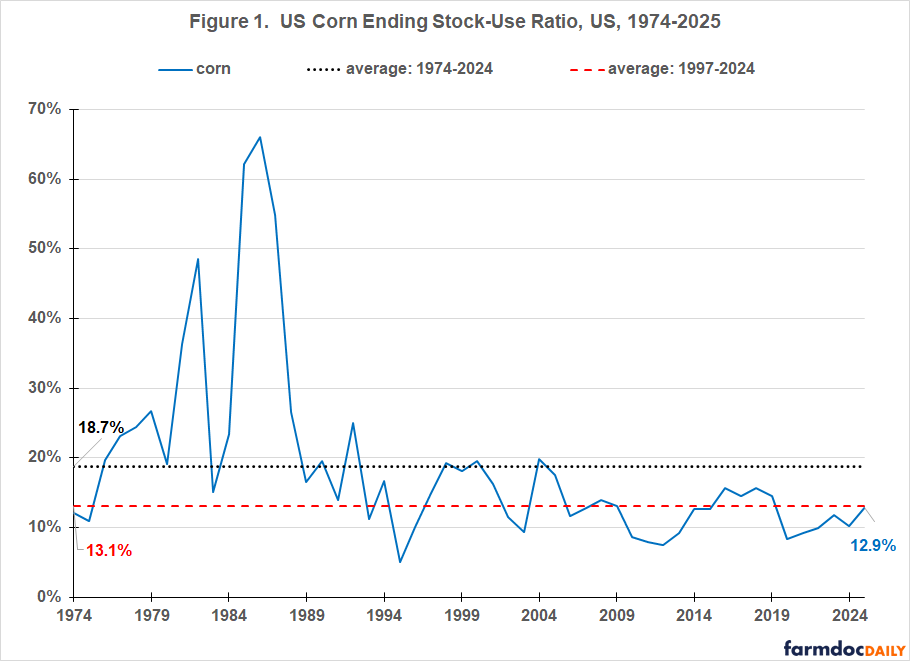
US estimated 2025 corn ending stock-to–use ratio is 12.9% (see Figure 1). This is notably below the average ratio since 1974 (18.7%) and nearly identical to the average since 1997 (13.1%), the year after the 1996 farm bill eliminated most US public stock programs. Current US corn stock-use ratio is not burdensome even though it is notably higher than for 2024 (10.3%). Comparing only to last year is too narrow and potentially deceiving. Figure 1 and all other figures in this article use data from PSD (Production, Supply, and Distribution), a USDA, FAS (US Department of Agriculture, Foreign Agriculture Service) database.
Source : illinois.edu