Overview
Corn, cotton, and soybeans were down; wheat was up for the week.
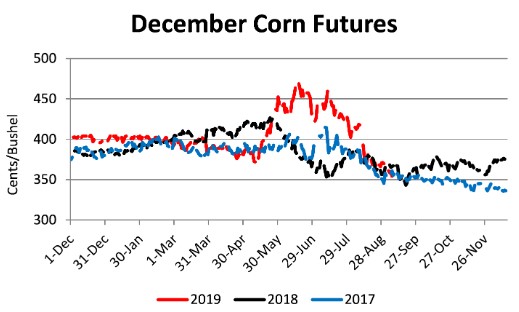
Corn and soybean prices have continued to decrease from June highs. December corn peaked at $4.73 on June 17. On Friday, the contract set a new low at $3.58 ¼, a decrease of $1.14 ¾ (or a 24% loss in value). Similarly, November soybeans had a June high of $9.48 on June 18. On Friday, the contract closed at $8.57 ¾, a decrease of $0.90 ¼ (or a 9.5% loss in value). Soybeans started from a depressed value due to the ongoing trade dispute with China that has had a dramatic impact on soybean and cotton prices. While prices could revert due to a weather (such as an early frost) or trade event (resolution of the trade dispute with China, resulting in large agricultural purchases), it seems more likely that prices will continue to soften as harvest progresses and moves north. Storing the crop to avoid seasonal lows and extend the marketing window should be strongly considered.
Cotton futures prices continue to languish below 60 cents. Increased estimated production from the US (5.38 million bales greater than the previous 5-year average) and Brazil (3.572 million bales above the 5-year average) will continue to pressure prices lower. Additionally, low synthetic fiber prices and continued trade issues with China make a path to substantially higher prices seem very unlikely this fall/winter.
This week the USDA opened enrollment for the Agriculture Risk Coverage (ARC) and Price Loss Coverage (PLC) programs. Enrollment is open for the 2019 crop year, however farmers have until March 15, 2020, to finalize sign up. Farmers can enroll for the 2020 crop year starting Oct. 7 and continuing until June 30, 2020. Patience may be the best course of action when signing up for ARC and PLC, as additional market and production information will be revealed between now and the sign up deadlines that will aid in the decision making process. Farmers should fully investigate how the programs work to ensure an informed decision is made at the appropriate time. Additionally, under the 2018 Farm Bill, farmers get a one-time chance to update their payment yields for the 2020 crop year and beyond.
| Previous | Current | Change |
USD Index | 98.89 | 98.35 | -0.54 |
Crude Oil | 54.95 | 56.57 | 1.62 |
DJIA | 26,336 | 26,810 | 474 |
Corn
Ethanol production for the week ending August 30 was 1.013 million barrels per day, down 25,000 from the previous week. Ethanol stocks were 23.801 million barrels, up 0.819 million barrels. Corn net sales reported by exporters for August 23-29 were down from last week with net sales cancelations of 6.5 million bushels for the 2018/19 marketing year and net sales of 16.4 million bushels for the 2019/20 marketing year. Exports for the same time period were down 38% from last week at 15.0 million bushels. Corn export sales and commitments were 94% of the USDA estimated total annual exports for the 2018/19 marketing year (September 1 to August 31) compared to the previous 5-year average of 104%. Nationally, the Crop Progress report estimated corn condition at 58% good-to-excellent and 13% poor-to-very poor; corn dough at 81% compared to 71% last week, 95% last year, and a 5-year average 93%; corn dented at 41% compared to 27% last week, 73% last year, and a 5-year average of 63%; and corn mature at 6% compared to 20% last year and a 5-year average of 13%. In Tennessee, the Crop Progress report estimated corn condition at 86% good-to-excellent and 1% poor-to-very poor; corn dough at 98% compared to 96% last week, 100% last year, and a 5-year average of 99%; corn dented at 87% compared to 79% last week, 92% last year, and a 5-year average of 89%; corn mature at 42% compared to 21% last week, 44% last year, and a 5-year average of 42%; and corn harvested at 5% compared to 1% last week, 8% last year, and a 5-year average of 6%. Across Tennessee, average corn basis (cash price-nearby futures price) strengthened or remained unchanged at Memphis and Northwest Barge Points and weakened at Upper-middle and Northwest Tennessee. Overall, basis for the week ranged from 41 under to 4 under with an average of 22 under the December futures at elevators and barge points. December 2019 corn futures closed at $3.55, down 14 cents since last Friday. Downside price protection could be obtained by purchasing a $3.60 December 2019 Put Option costing 16 cents establishing a $3.44 futures floor. For the week, December 2019 corn futures traded between $3.53 and $3.70.
Corn | Dec 19 | Change | Dec 20 | Change |
Price | $3.55 | -$0.14 | $3.96 | -$0.08 |
Support | $3.49 | -$0.16 | $3.93 | -$0.08 |
Resistance | $3.63 | -$0.13 | $4.01 | -$0.06 |
20 Day MA | $3.72 | -$0.11 | $4.04 | -$0.03 |
50 Day MA | $4.07 | -$0.07 | $4.11 | -$0.02 |
100 Day MA | $4.11 | -$0.01 | $4.12 | $0.00 |
4-Week High | $4.24 | $0.00 | $4.16 | $0.00 |
4-Week Low | $3.49 | -$0.15 | $3.96 | -$0.05 |
Technical Trend | Strong Down | - | Strong Down | = |
Dec/Mar and Dec/Dec future spreads were 13 and 41 cents. March 2020 corn futures closed at $3.68, down 14 cents since last Friday. In Tennessee, new crop corn cash contracts averaged $3.77 with a range of $3.73 to $3.80. December 2020 corn futures closed at $3.96, down 8 cents since last Friday.
Soybeans
Net sales reported by exporters were up compared to last week with net sales of 2.6 million bushels for the 2018/19 marketing year and 29.0 million bushels for the 2019/20 marketing year. Exports for the same period were up 37% compared to last week at 44.0 million bushels. Soybean export sales and commitments were 105% of the USDA estimated total annual exports for the 2018/19 marketing year (September 1 to August 31), compared to the previous 5-year average of 104%. Nationally, the Crop Progress report estimated soybean condition at 55% good-to-excellent and 13% poor-to-very poor; soybeans blooming at 96% compared to 94% last week, 100% last year, and a 5-year average of 100%; and soybeans setting pods at 86% compared to 79% last week, 98% last year, and a 5-year average of 96%. In Tennessee, the Crop Progress report estimated soybean condition at 75% good-to-excellent and 3% poor-to-very poor; soybeans blooming at 95% compared to 93% last week, 100% last year, and a 5-year average of 100%; soybeans setting pods at 89% compared to 83% last week, 97% last year, and a 5-year average of 94%; and soybeans dropping leaves at 17% compared to 4% last week, 8% last year, and a 5-year average of 8%. In Tennessee, October/November 2019 soybean cash contracts average $8.28 with a range of $7.94 to $8.62. Average soybean basis weakened or remained unchanged at Memphis, Northwest Barge Points, Northwest, and Upper-middle Tennessee. Basis ranged from 68 under to 23 under the November futures contract at elevators and barge points. Average basis at the end of the week was 41 under the November futures contract. November 2019 soybean futures closed at $8.57, down 12 cents since last Friday. Downside price protection could be achieved by purchasing an $8.60 November 2019 Put Option which would cost 20 cents and set an $8.40 futures floor. For the week, November 2019 soybean futures traded between $8.56 and $8.79. November/December soybean-to-corn price ratio was 2.41 at the end of the week.
Soybeans | Nov 19 | Change | Jan 20 | Change |
Price | $8.57 | -$0.12 | $8.72 | -$0.10 |
Support | $8.49 | -$0.11 | $8.64 | -$0.09 |
Resistance | $8.70 | -$0.12 | $8.83 | -$0.12 |
20 Day MA | $8.70 | -$0.01 | $8.84 | -$0.01 |
50 Day MA | $8.87 | -$0.05 | $9.00 | -$0.05 |
100 Day MA | $8.87 | -$0.03 | $9.00 | -$0.02 |
4-Week High | $8.96 | -$0.04 | $9.10 | -$0.03 |
4-Week Low | $8.52 | $0.00 | $8.66 | $0.00 |
Technical Trend | Strong Down | - | Strong Down | - |
Nov/Jan and Nov/Nov future spreads were 15 and 65 cents. Nov/Dec 2020 soybean-to-corn price ratio was 2.33 at the end of the week. January 2020 soybean futures closed at $8.72, down 10 cents since last Friday. November 2020 soybean futures closed at $9.22, down 9 cents since last Friday.
Cotton
Net sales reported by exporters were up compared to last week with net sales of 162,800 bales for the 2019/20 marketing year and 198,200 bales for the 2020/21 marketing year. Exports for the same time period were up 35% compared to last week at 230,000 bales. Upland cotton export sales were 51% of the USDA estimated total annual exports for the 2019/20 marketing year (August 1 to July 31), compared to the previous 5-year average of 46%. Nationally, the Crop Progress report estimated cotton condition at 48% good-to-excellent and 15% poor-to-very poor; cotton setting bolls at 97% compared to 90% last week, 95% last year, and a 5-year average of 96%; and cotton bolls opening at 36% compared to 28% last week, 28% last year, and a 5-year average of 27%. In Tennessee, the Crop Progress report estimated cotton condition at 83% good-to-excellent and 2% poor-to-very poor; cotton setting bolls at 100% compared to 97% last week, 100% last year, and a 5-year average of 98%; and cotton bolls opening at 13% compared to 8% last week, 48% last year, and a 5-year average of 26%. Delta upland cotton spot price quotes for September 5 were 57.16 cents/lb (41-4-34) and 59.41 cents/lb (31-3-35). Adjusted World Price (AWP) increased 0.12 cents to 51.57 cents. December 2019 cotton futures closed at 58.58, down 0.25 cents since last Friday. For the week, December 2019 cotton futures traded between 57.55 and 59.86 cents. Downside price protection could be obtained by purchasing a 59 cent December 2019 Put Option costing 2.32 cents establishing a 56.68 cent futures floor.
Cotton | Dec 19 | Change | Mar 20 | Change |
| | | | |
Price | 58.58 | -0.25 | 59.32 | -0.12 |
Support | 56.99 | -1.03 | 57.93 | -0.83 |
Resistance | 60.65 | 0.95 | 61.09 | 0.81 |
20 Day MA | 58.87 | -0.09 | 59.62 | -0.17 |
50 Day MA | 61.58 | -0.59 | 62.49 | -0.59 |
100 Day MA | 65.60 | -0.73 | 66.37 | -0.72 |
4-Week High | 60.25 | -3.72 | 60.82 | -4.08 |
4-Week Low | 56.59 | 0.00 | 57.65 | 0.00 |
Technical Trend | Down | - | Down | - |
Dec/Mar and Dec/Dec cotton futures spreads were 0.74 cents and 3.25 cents. March 2020 cotton futures closed at 59.32, down 0.12 cents since last Friday. December 2020 cotton futures closed at 61.83, down 0.45 cents since last Friday.
Wheat
Nationally, the Crop Progress report estimated spring wheat condition at 67% good-to-excellent and 8% poor-to-very poor; and spring wheat harvested at 55% compared to 38% last week, 86% last year, and a 5-year average of 78%. Wheat net sales reported by exporters were down compared to last week with net sales of 11.5 million bushels for the 2019/20 marketing year. Exports for the same time period were up 27% from last week at 20.5 million bushels. Wheat export sales were 43% of the USDA estimated total annual exports for the 2019/20 marketing year (June 1 to May 31), compared to the previous 5-year average of 48%. In Tennessee, September 2019 wheat cash contracts ranged from $4.49 to $4.84 for the week. December 2019 wheat futures closed at $4.63, up 1 cent since last Friday. December 2019 wheat futures traded between $4.50 and $4.69 this week. December wheat-to-corn price ratio was 1.30.
Wheat | Dec 19 | Change | Jul 20 | Change |
Price | $4.63 | $0.01 | $4.79 | $0.00 |
Support | $4.57 | $0.06 | $4.74 | $0.03 |
Resistance | $4.70 | -$0.08 | $4.82 | -$0.08 |
20 Day MA | $4.72 | -$0.06 | $4.87 | -$0.07 |
50 Day MA | $4.96 | -$0.07 | $5.12 | -$0.07 |
100 Day MA | $4.98 | -$0.01 | $5.16 | -$0.02 |
4-Week High | $5.06 | $0.00 | $5.22 | $0.00 |
4-Week Low | $4.50 | -$0.09 | $4.68 | -$0.08 |
Technical Trend | Strong Down | = | Strong Down | = |
Dec/Mar and Dec/Jul future spreads were 7 and 16 cents. March 2020 wheat futures closed at $4.70, unchanged since last Friday. In Memphis, June/July 2020 cash contracts ranged from $4.79 to $4.80. July 2020 wheat futures closed at $4.79, unchanged since last Friday. Downside price protection could be obtained by purchasing a $4.80 July 2020 Put Option costing 31 cents establishing a $4.49 futures floor.