By Joe Janzen
Department of Agricultural and Consumer Economics
University of Illinois
By Bryn Swearingen
Department of Agricultural Economics
Kansas State University
Grain storage infrastructure comes in many forms: bins, elevators, bunkers, and sheds. Storage infrastructure has at least two main uses. First, it enables farmers, commercial grain merchants, and end-users to hold commodity inventories over time. Storing grain to profit from differences in prices across time addresses variation in grain production and consumption within and across crop marketing years, the annual period defined by typical harvest timing.
Second, grain storage facilitates other activities of these firms. For example, farmers use grain storage to improve harvest logistics when commercial grain elevators are too congested or distant to allow for efficient harvest progress. For commercial grain merchants, storage infrastructure enables transformation of grain in space and form, moving grain from where it is relatively abundant and cheap to where it is relatively scarce and abundant. For example, merchants like grain elevators use storage space to facilitate efficient grain aggregation and movement to end-users, maintaining grain quality and lowering per-unit handling costs.
In this article, we review changes in US grain storage capacity across time. Over the past decade, there has been persistent talk of ‘disintermediation’ in grain markets. and
Successful Farming, July 1, 2014) Generally, disintermediation refers to a reduced role for intermediaries like grain merchants in the movement of grain from farmer to end-user. Growth in the share of storage capacity and grain inventories on farms (relative to off-farm) would provide some evidence of an expanded role for farms in grain supply chains.
We describe national and regional grain storage capacity and stocks between 1988 and 2019. The data reveal four trends:
- Grain storage capacity in the United States has consistently increased for the last twenty years. This growth has been proportional to increases in crop production.
- Off-farm storage capacity has grown faster than on-farm capacity, but that growth is slowing.
- Storage capacity utilization increased in the 1990s and has been relatively flat since.
- Corn consistently uses most US grain storage capacity by volume, but other commodities make significant use of storage infrastructure in specific times-of-year, or when grain movement is disrupted and demand for storage increases.
Trends in Storage Capacity and Production
US grain storage capacity has grown substantially in the last 20 years. The USDA National Agricultural Statistics Service (NASS) releases annual state-level data on grain storage capacity as part of its
Grain Stocks reports. It designates storage capacity as on-farm, which includes “bins, cribs, and sheds, and other structures located on farms” and off-farm, which includes “elevators, warehouses, terminals” and other built infrastructure normally used to store grains, oilseeds, and pulse crops.
Figure 1 shows NASS-estimated US grain storage capacity since 1988. In 2019, national grain storage capacity was approximately 25 billion bushels. In the late 1990s, US grain storage capacity bottomed out at about 19 billion bushels after years of decline. Recall that before the 1990s, US government policy encouraged much higher levels of grain stocks and consequently much more grain storage infrastructure. Even though crop production increased in the 1990s, storage capacity did not; grain storage infrastructure had been overbuilt relative to the demand for storage.
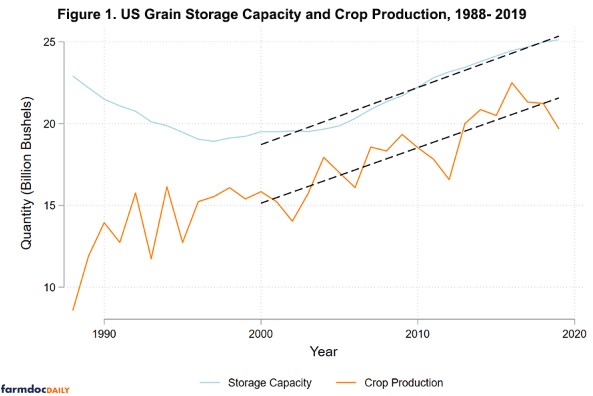
Storage capacity growth since 2000 has been closely related to increasing crop production. Figure 1 also plots annual crop production of corn, soybeans, and wheat plus other minor crops whose inventories are estimated in the Grain Stocks report, namely barley, oats, sorghum and sunflowers. The figure also plots linear trends in production and capacity since 2000. The two trend lines show crop production and storage capacity have grown roughly bushel-for-bushel over the past 20 years. On average, crop production increased by 339 million bushels each year while grain storage capacity increased by 349 million bushels annually. Growth in total US grain storage capacity was particularly pronounced during the period from 2006-12, coinciding with the simultaneous booms in US ethanol production and Chinese commodity demand.
Grain storage capacity trends differ between on- and off-farm locations and across regions. Figure 2 aggregates state-level data for major grain producing states into four regions of comparable capacity. It plots on- and off-farm storage capacity across time. All regions and locations roughly follow the pattern of capacity declines from 1988 to 2000 and growth from 2000 to present seen in aggregate in Figure 1. Regions differ substantially in the share of grain storage capacity on-farm. There is proportionally more on-farm storage capacity in the Western Corn Belt and Northern Great Plains, regions generally further from end-users with relatively weaker cash commodity prices.
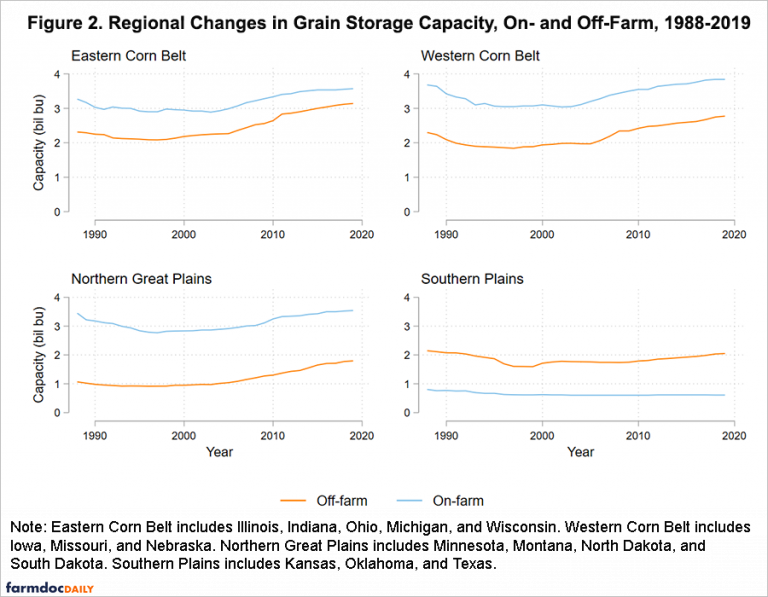
However, off-farm capacity has grown faster than on-farm capacity in all regions. Off-farm capacity was 46% of total capacity in 2019, up from 43% in 2000. In the major grain producing regions shown in Figure 2, there was a four percentage point increase in the share of capacity off-farm in all regions except the Northern Great Plains which saw a nine point change. While this change in off-farm share is not extreme, it contradicts the narrative of a growing role for farmers in the grain storage and handling activity traditional carried out by grain merchant firms.
One caveat is that farmers could be expanding their role in grain storage and handling via investments in off-farm storage, possibly through ownership in grain merchandising cooperatives. While NASS data does not distinguish between cooperative and non-cooperative ownership of off-farm storage capacity, we have gathered data on grain storage ownership for the state of Kansas in 2000 and 2016. Roughly equal parts of the growth in off-farm grain storage capacity in that state over that period came from cooperative and non-cooperative firms. To the extent this holds true elsewhere, it again contradicts the idea that farmers are taking an increased overall role in grain storage and handling.
Grain Stocks and the Usage of Grain Storage Capacity
Data on grain storage capacity alone do not describe how capacity is used. To do this, we gather data on inventories of corn, soybeans, wheat, and minor crops from the NASS quarterly Grain Stocks report. We calculate storage capacity utilization as inventory divided by storage capacity on each of the four dates reported by NASS. We order these dates according to the corn and soybean marketing year.
Figure 3 describes average capacity utilization by quarter through the marketing year for four roughly equal length periods selected in part by the relative scarcity of major grains. For instance, we calculate average capacity utilization for the commodity price boom period of 2006/07 to 2013/14 to compare it to the periods of higher inventory and lower prices before and after. Grain storage capacity utilization (or the proportion of storage capacity holding grain on a given date) rose during the 1990s as storage capacity fell. Following the rationalization of storage infrastructure, average US capacity utilization on December 1 has been relatively constant. Capacity utilization generally peaks each December following the completion of grain harvest throughout the country. Inventories fall throughout the remainder of the year as grain is fed, processed, or exported. In the 1990s, average peak utilization was about 55%. In the 2000s and 2010s, it was about 65%.
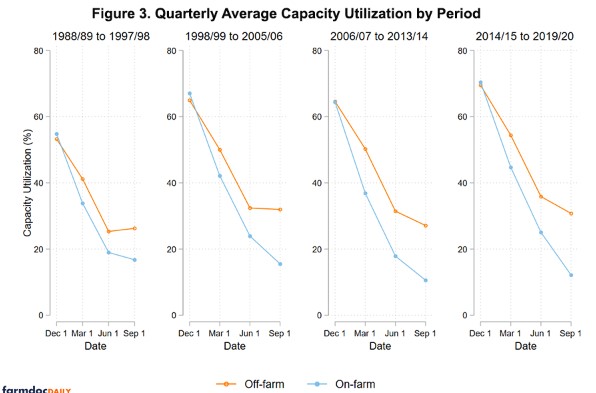
While on-farm and off-farm capacity utilization patterns in Figure 3 are similar, on-farm stocks are generally drawn down to a lower level (relative to total capacity) by the end of the marketing year. This was especially so during the commodity boom of 2006-2014. This reflects in part the farmers need to create binspace for the next harvest and the opportunity cost of holding grain across crop years. Year-end off-farm inventories and capacity utilization are also higher for the simple reason that stocks remaining in the grain transportation and handling supply chain by near the end of the marketing year are likely to be further from the farm and closer to end-users.
Grain storage capacity utilization illustrated in Figure 3 also reflects changes in US crop production over time. The increase in capacity utilization between June 1 and September 1 observed in the 1990s is mainly related to the harvest timing for wheat (and other summer-harvested crops.) As US wheat acres and production have declined the increase in inventories of summer-harvested crops like wheat has been dominated by the concurrent reduction in stocks of corn, soybeans, and other fall-harvested crops. In the 2000s and 2010s, off-farm capacity utilization falls rather than rises between June 1 and September 1. This change is concentrated off-farm because most grain storage in the Southern Plains is off-farm (see Figure 2).
Grain Storage Capacity Use by Commodity
As mentioned, changes in how grain storage is used can in part be explained by the composition of crops being stored. Corn, soybeans, wheat, and other crops differ with respect to absolute quantity, harvest timing, and production location. Figure 5 shows the proportion of total storage capacity used to store specific crops either on-farm or off-farm by quarter since December 2010. Inventories vary across marketing years with changes in production and inventory demand. For example, capacity utilization in the 2012-13 marketing is extremely low because of drought-inflicted declines in corn and soybean production that year.
Nationally, corn dominates grain inventories. At the post-harvest December 1 peak, corn makes up more than three-quarters of US grain inventories with the majority of corn inventory held on-farm. For other major crops, off-farm inventories are more important with the majority of soybean, wheat, and other grain inventories held off-farm at the post-harvest inventory peak.
On-farm storage is used differently than off-farm storage. Farmers rarely hold substantial inventories at the end of a marketing year. Second quarter inventories of wheat and barley and third quarter inventories of corn, soybeans, and other grains were held almost entirely held off-farm. Figure 4 makes plain that on-farm storage is not in aggregate playing a larger role in the storage of major grains in the US. Except for corn, off-farm inventories are greater for all crops at all times of the year.
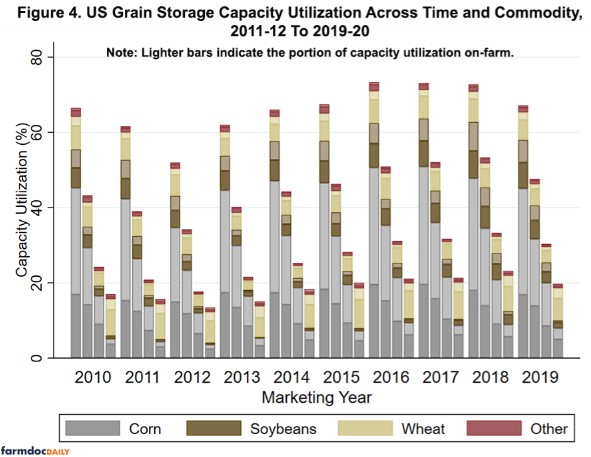
While corn dominates US grain storage infrastructure, other commodities periodically make greater use of grain storage. For example, the effect of the US-China trade conflict can be seen in Figure 4. During the 2018-19 marketing year, soybean inventories increased relative to prior years, especially year-end off-farm inventories.
The data in Figure 4 only describe inventory quantities relative to capacity. To truly measure the economic efficiency of grain storage capacity utilization, we would need to consider the risk-adjusted returns to storage similar to Zulauf and Kim . Such analysis is beyond the scope of this article.
Conclusions
This article describes how US grain storage capacity has increased since approximately 2000. This growth has been proportional to production, but the rate of growth has been slowing. Off-farm storage capacity has grown faster than on-farm capacity, suggesting that disintermediation of grain supply chains is not a primary driver for investment in new grain storage capacity. Once grain storage capacity, both on- and off-farm was rationalized after the 1990s, capacity utilization has been fairly stable across time, though major supply and demand shocks causes year-to-year changes in how grain storage is used.
Observed trends in storage capacity and grain inventory suggest three forward-looking conclusions:
- Grain storage capacity growth is slowing. Future investments in new grain storage capacity have uncertain benefits.
- Significant recent investments in off-farm storage suggest that the grain merchants who own and operate that infrastructure will remain an important part of grain supply chains. These firms have an important role to play in mediating commodity transformations in time, space, and form.
- Low margins in production agriculture may encourage farms to increase capacity utilization of all capital assets including grain storage infrastructure. This may occur through both higher inventories or declining investment in capacity. Though grain storage infrastructure nationally is about 70% full at the end of the fall harvest period (on December 1), we cannot tell from these data how much capacity utilization could be increased. Grain storage capacity will never be optimally located for the unique grain storage demand that exists in any specific marketing year. Moreover, we do not observe the true peak demand for storage capacity at each location; it is unlikely to occur on one of the four calendar dates where USDA estimates stocks. We also know that pure storage arbitrage – holding grain in order to profit from differences in prices across time – is only one motive for grain storage. These data cannot tell us the degree to which such storage arbitrage drives observed stocks.
Source : illinois.edu